


by Mark Schniepp
January 2017
Happy New Year
The financial markets finished the year with double digit returns for calendar 2017 and the Dow Jones Industrial Average barely missed hitting the 20,000 mark on Tuesday, December 27. Currently (January 4th), it is only about 32 points from its all time record high.
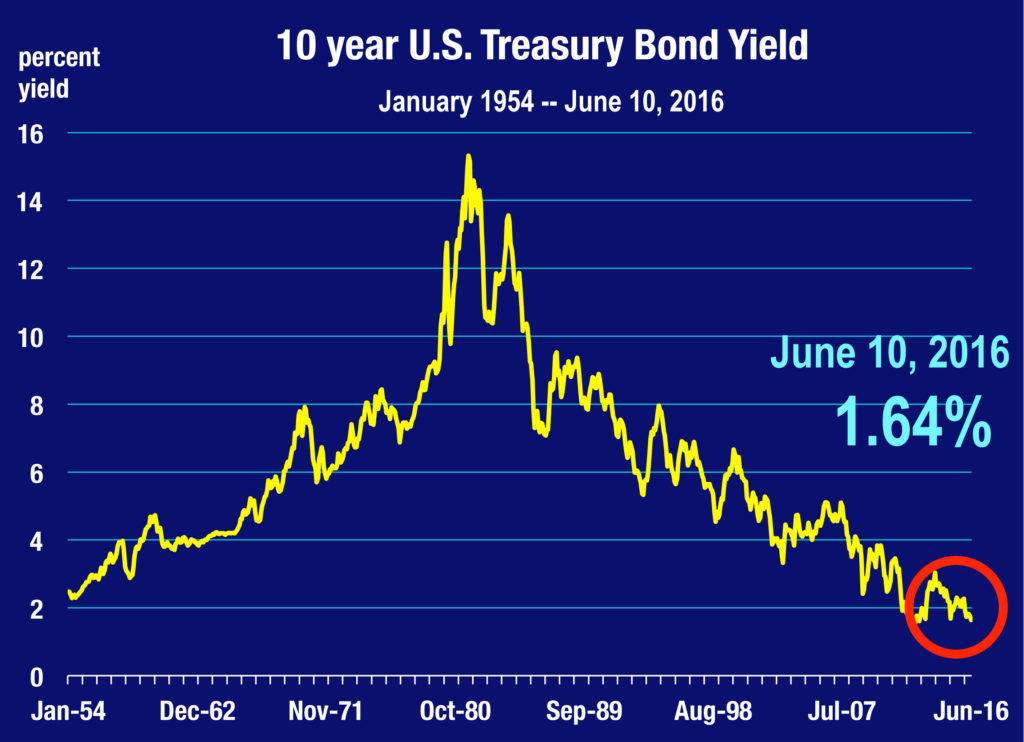
Bond prices appear to have stabilized for the moment, hovering around 2.5 percent for the 10 year Treasury and fixed mortgage rates are at 4.2 percent. The price of crude oil (and therefore gasoline) also appears stable at this writing.
We’ve reached the full employment level in the labor force, consumers are feeling very good today and about the coming year, and conditions for business expansion remain favorable. Depending on how fast the new Trump administration and Congress act, economic growth could attain its highest level of the current cycle in 2017.
Changes to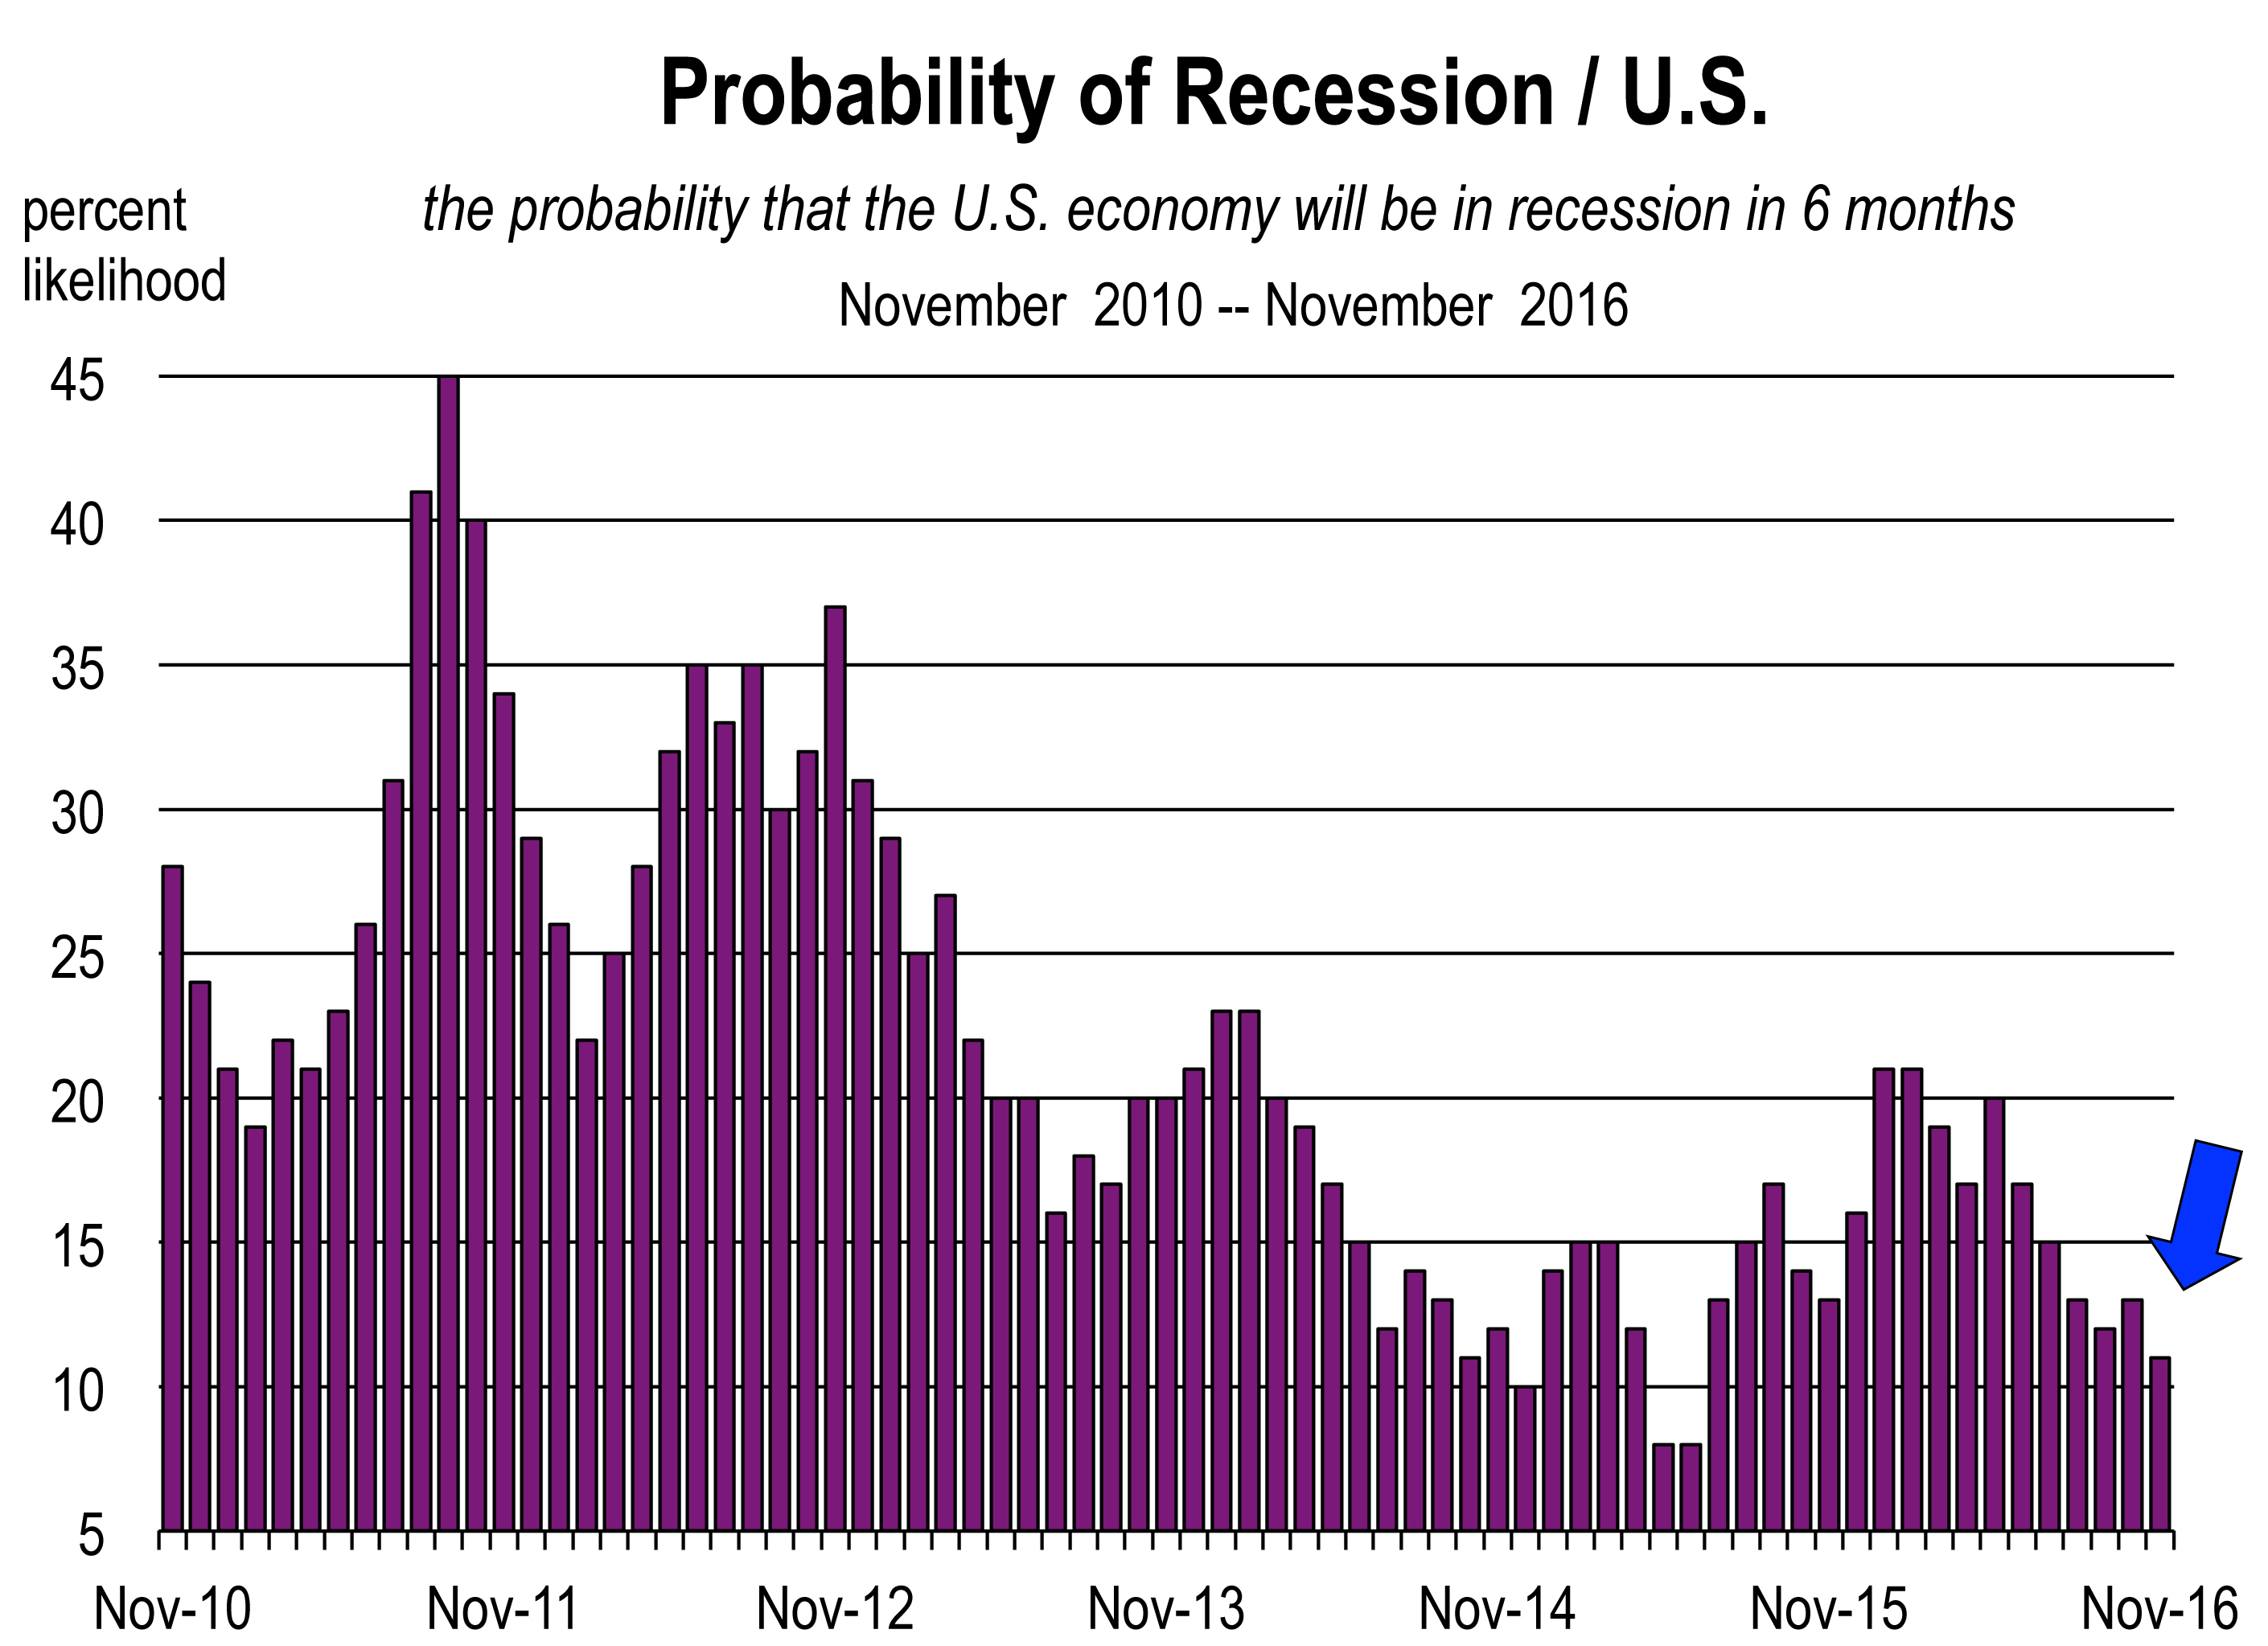 Expect
The president elect will inherit an economy that is fundamentally strong. With very few layoffs and with record numbers of open job positions, it would take a severe shock to derail the current economy.
Significant changes in policy may be forthcoming, such as tax law, public spending on defense and homeland security, trade and immigration policy, and regulation.
We expect the Trump administration to implement an expansionary fiscal policy of deficit-financed tax cuts and greater government spending this year. So expect higher deficits.
The tax cuts will affect both corporations and households and are expected to be sizeable.
Higher stock prices are a clear plus for growth, through the wealth effect on consumer spending. Since the election and the run-up of stock prices, households holding stock are now worth about $1 trillion more. To the extent the market does not falter, that should produce more spending which will increase the rate of economic growth this year and next.
 With bond rates rising, so are the myriad of interest rates. Higher rates of interest and inflation are in the base case scenario for 2017. That means that changes in these rates will not surprise the financial markets so no meltdown is expected.
The California Economy in 2017
You can expect an economy that looks much like it did in 2016 but with more jobs openings, more pressure to raise salaries and hourly rates of pay, and technology sectors that remain vibrant. This is because the world economy is growing faster again and there is rising demand for technology services and microprocessors.
Job creation is likely to be lower, simply because we are already running at full employment, so recruitment of workers will be difficult and more expensive.
The retail industry should have a banner year. Rates of retail real estate utilization are already low and sales remain moderate to strong depending on the region. With record levels of population, employment, and income, greater levels of spending on goods and services is inevitable.
The visitor industry is not expected to slow much despite the strengthening U.S. dollar. Some slowing has been noticed in a few areas of the State, including Santa Barbara. However, more domestic demand for California vacations will occur in 2017, and much of this will offset the reduction in foreign visitors who are now finding California (and the rest of the U.S.) too expensive.
If immigration law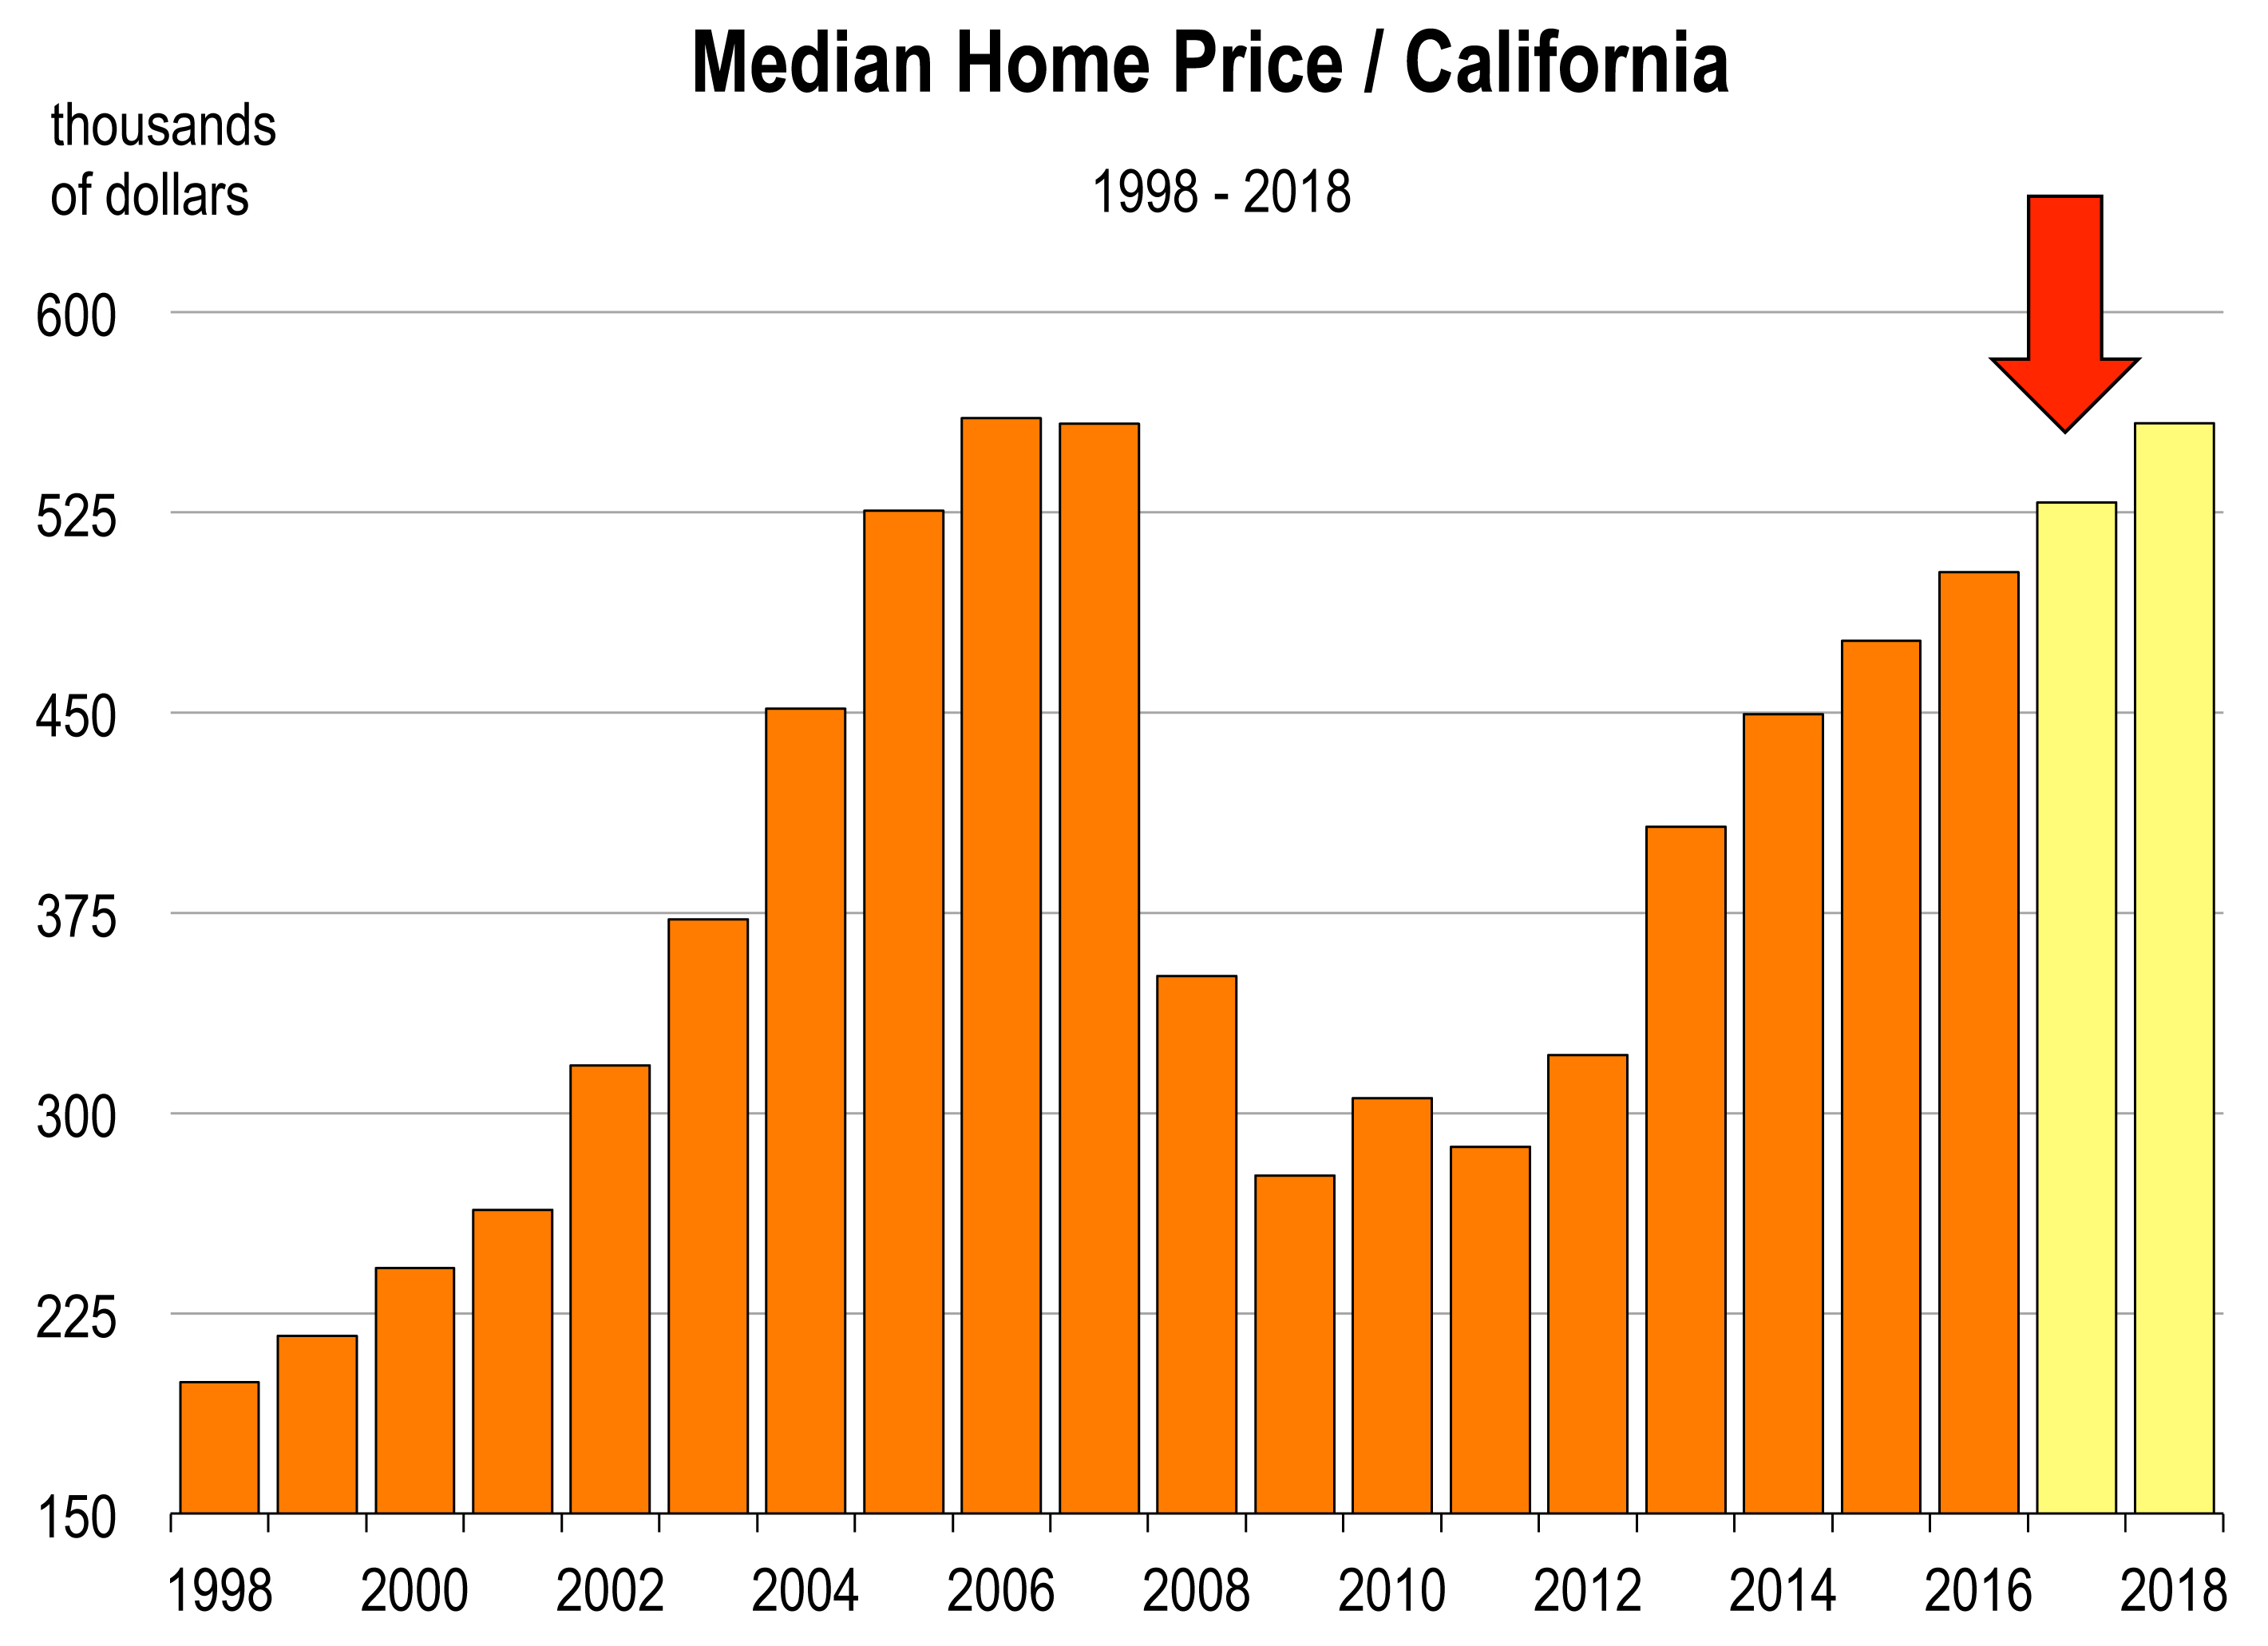 s are tightened and undocumented workers are deported, then the state’s agricultural, construction, and hospitality sectors will experience labor shortages. This will prompt higher wages and salaries and higher rates of inflation in California.
Technology industries are running strong and this is a principal reason that California has outpaced the nation in economic growth. Despite Trumpian rhetoric about bringing jobs back from the Pacific Rim to the U.S., there is likely to be more job creation abroad because tech companies cannot hire enough STEM educated workers here.
Housing will be impacted by higher rates throughout the U.S. but disproportionately in California. Why? Because higher mortgage rates drive monthly payments up by more on higher valued homes. And California has a higher share of higher valued homes than elsewhere. Also, less development of new housing in coastal areas will inhibit the growth of supply. If supply growth does not keep up with demand growth, prices rise. Coastal communities, including the Bay Area, are likely to experience fewer existing home sales in 2017 and higher selling prices.
Upcoming Forecast Conference:
![]()
2017 Entrepreneur Economic Forecast Conference
“Trumponomics, the Markets, and You”
February 2, 2017
New Building Industry Publication
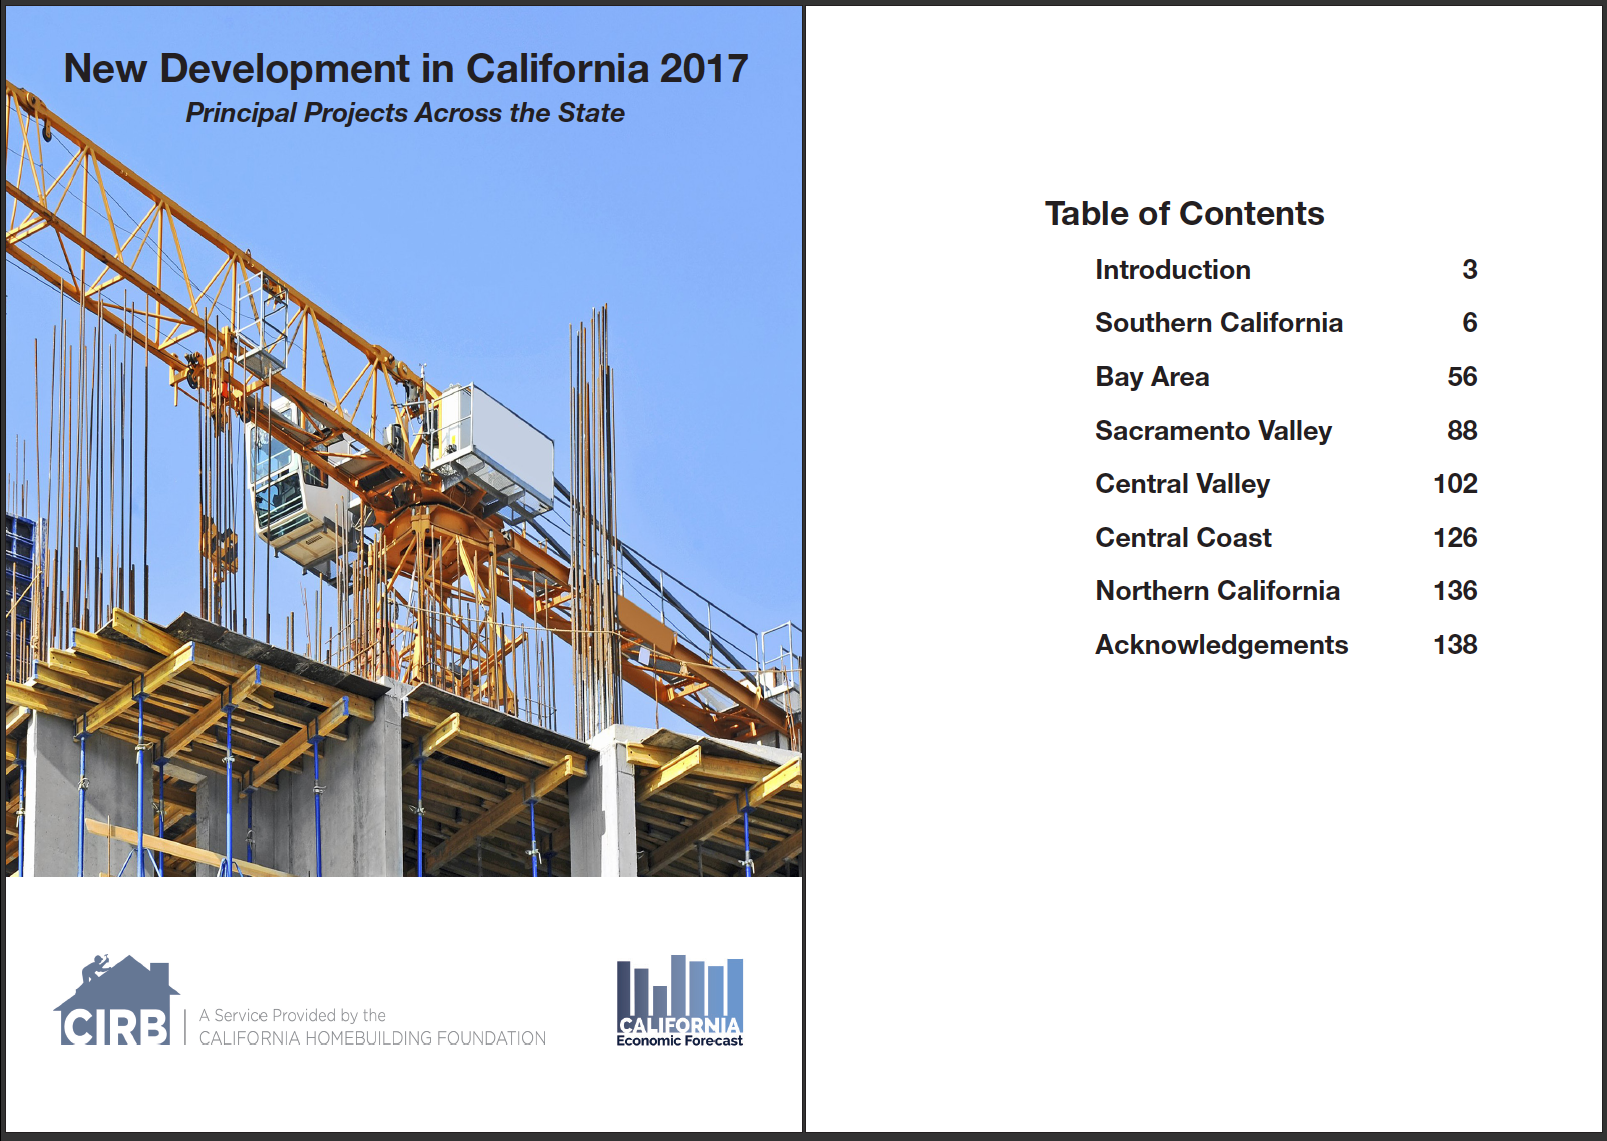
We have partnered with the California Homebuilding Foundation to bring you this exciting new report. In 130+ pages of analysis, we document the major development projects across the state. This report includes projects in all stages of development, from conceptual to nearly complete, and estimates the development pipeline in every major region.
Order your copy today from the California Homebuilding Foundation.
Housing Market Forecasts (Coming Soon)
Later this month we will be introducing new housing market forecasts. Covering all major markets in California, this new report will provide data and commentary on the real estate outlook for the next five years. Contact us for more information, and join our mailing list to be notified when they become available.
Contact Us Join Our Mailing List
The California Economic Forecast is an economic consulting firm that produces commentary and analysis on the U.S. and California economies. The firm specializes in economic forecasts and economic impact studies, and is available to make timely, compelling, informative and entertaining economic presentations to large or small groups.
![]()
 Financial market rally
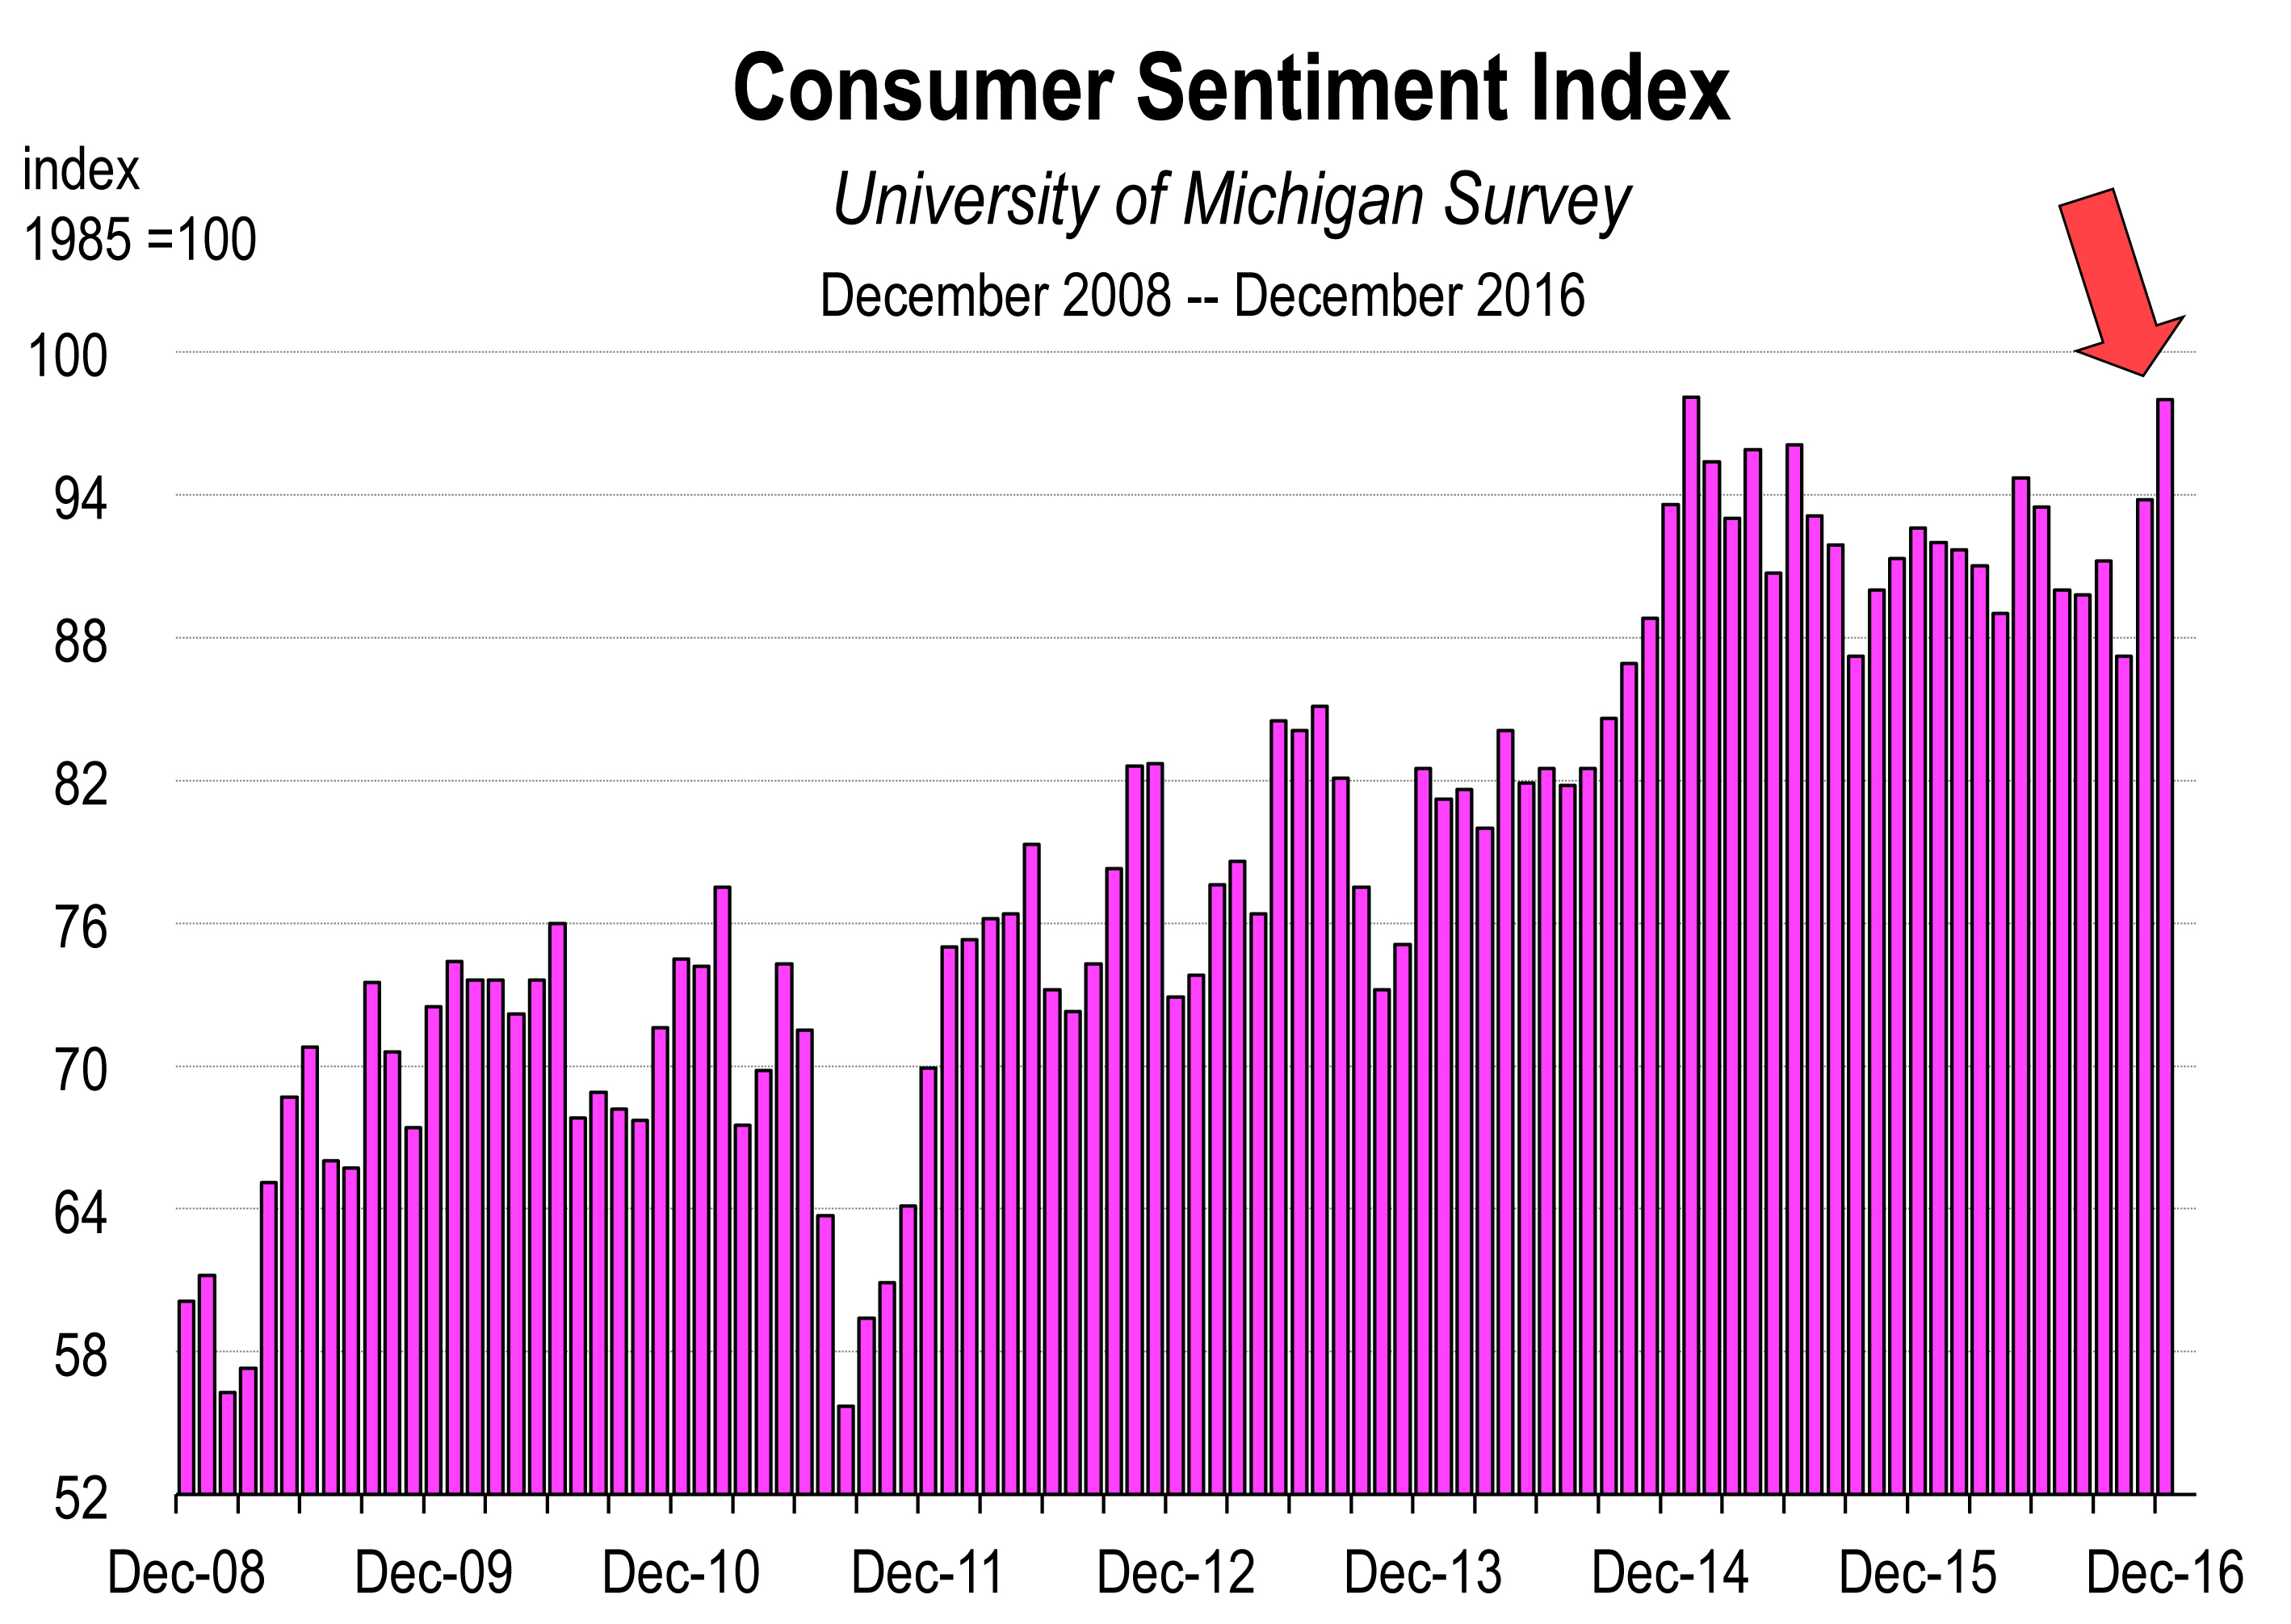 The Conference Board’s confidence reading for November was the highest in 9 1/2 years. The preliminary December report from the University of Michigan climbed sharply as well, rising to the highest level since December 2006. Consumers expect a positive impact of new economic policies following Donald Trump’s election. Furthermore, consumers feel more secure about the economy today and over the next 6 months then they have in years, largely because the labor market is at full employment, the stock market is at record highs, and incomes are rising.
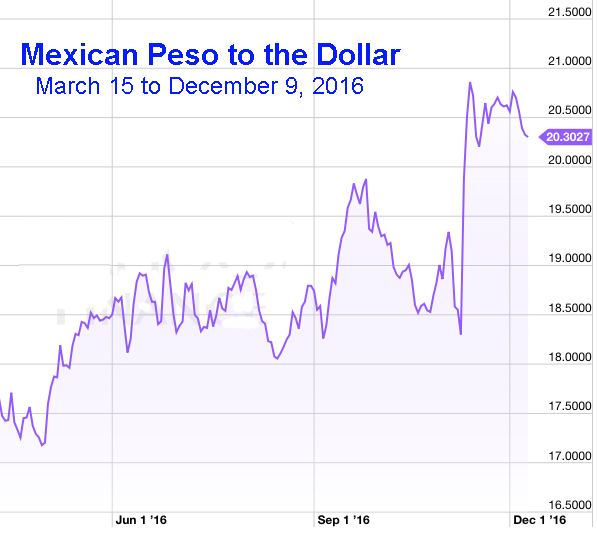 On December 9, the Euro fell to less than 1.06 in value against the dollar, the lowest level in 14 years. The dollar has rallied against most emerging market currencies and especially the Mexican peso, which has declined 52 percent in value (against our dollar) over the last two years.
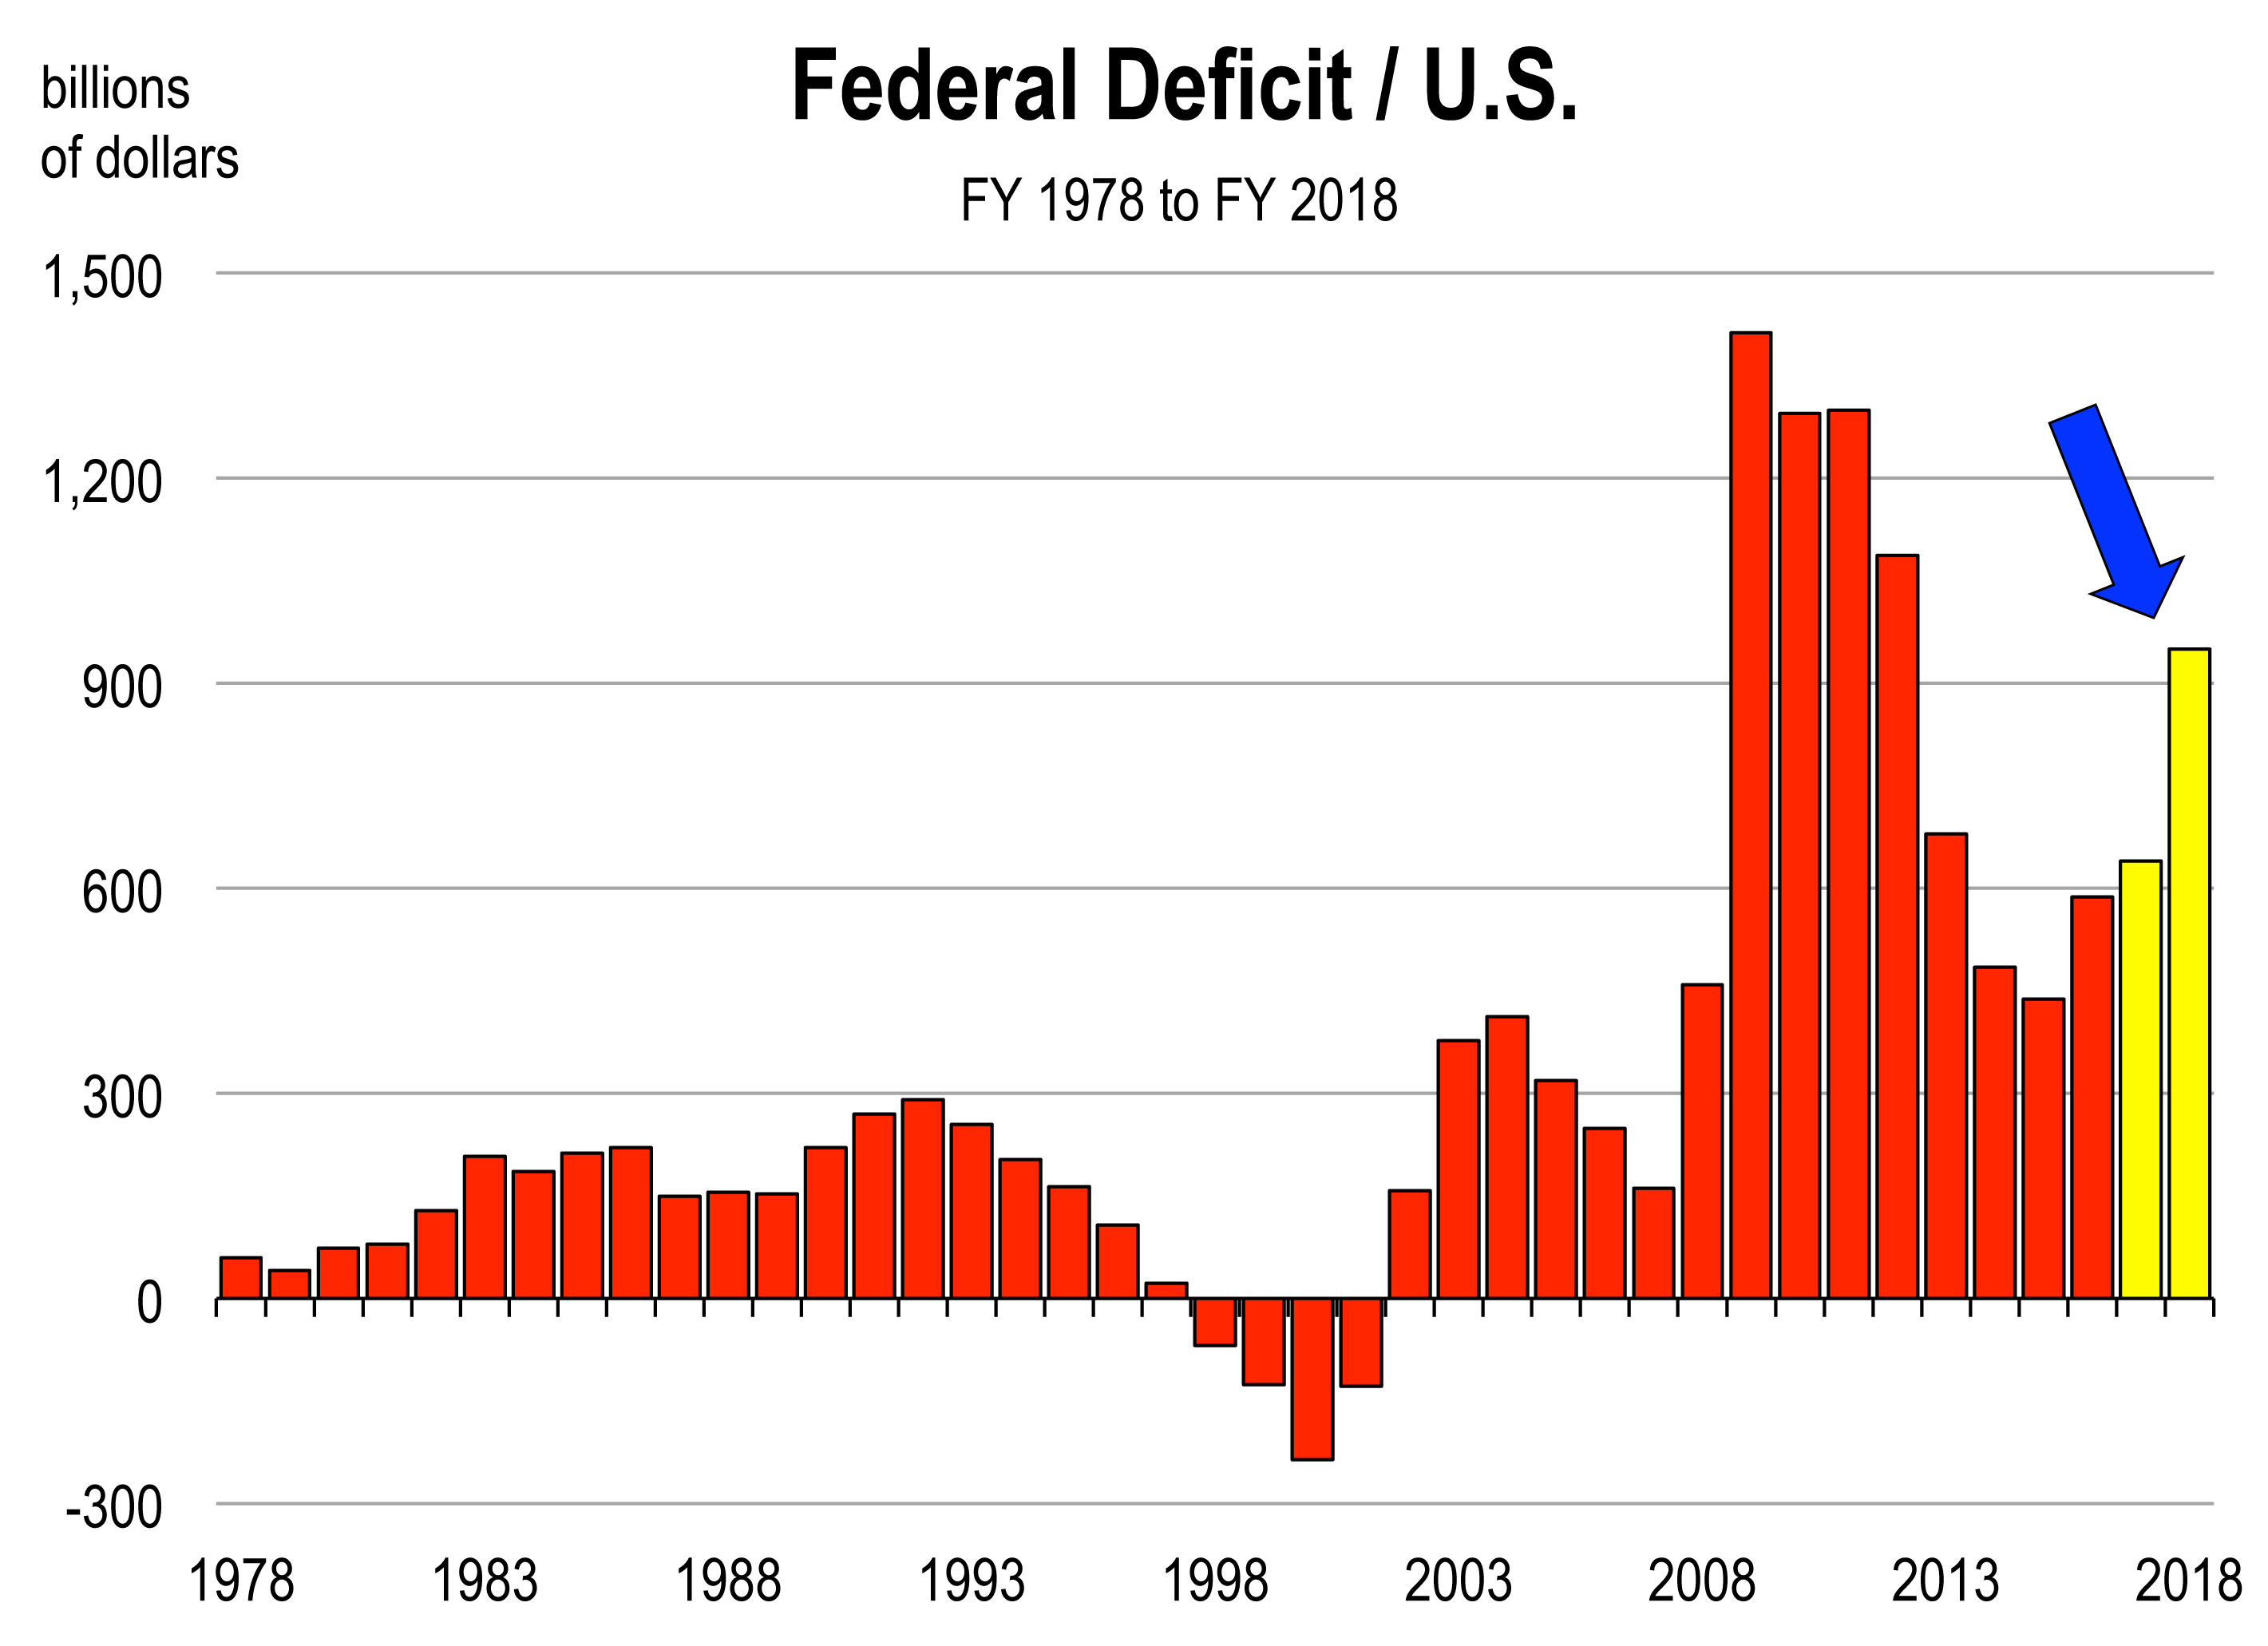 w bars are only forecasts, if Trumponomics is realized, you can chalk up another indicator that is likely to rise sharply.
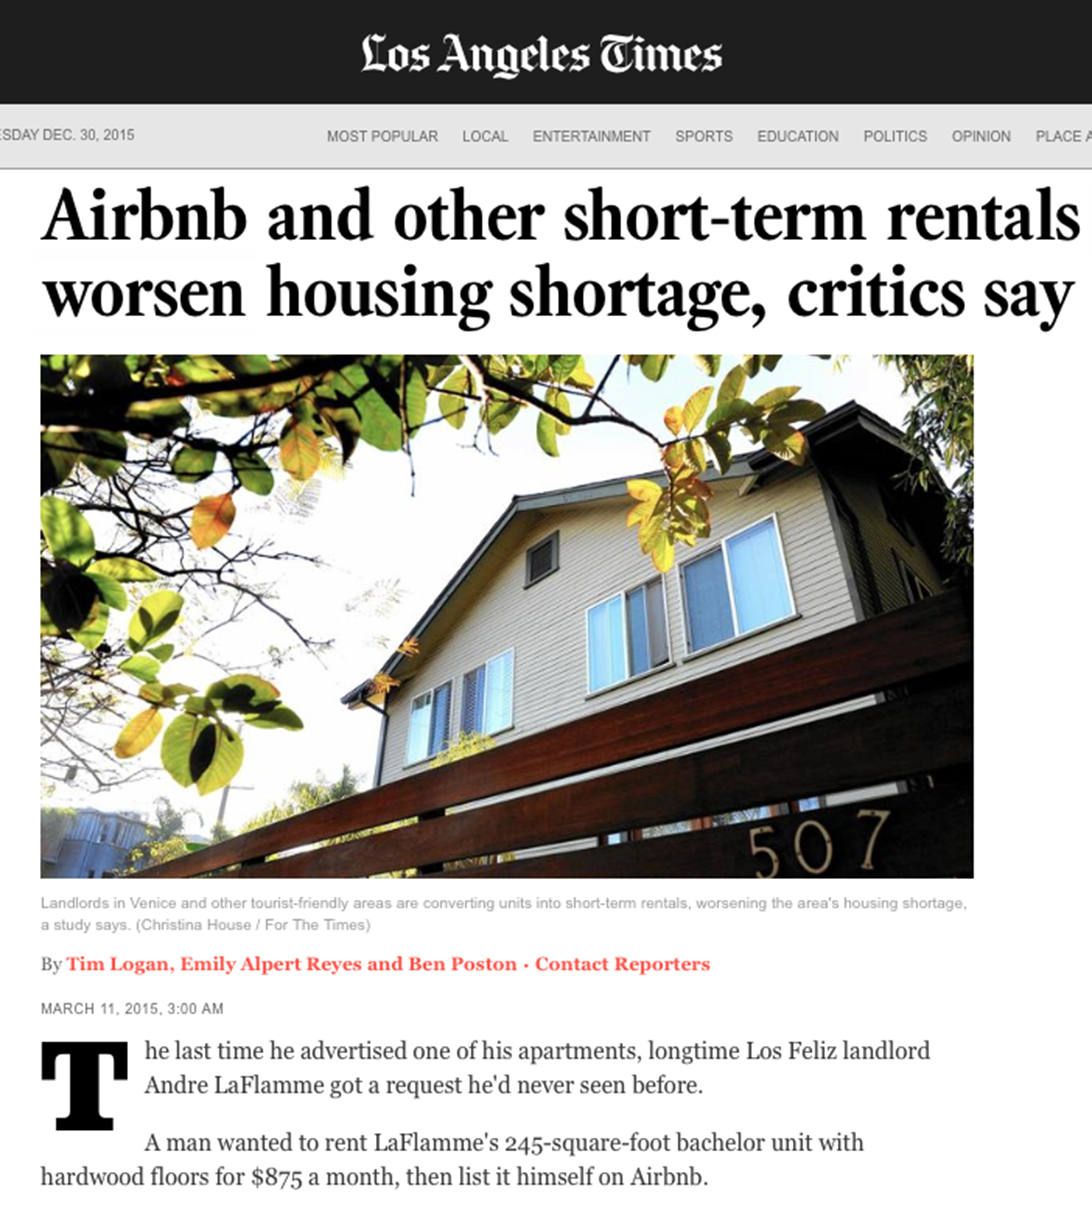 Los Angeles Times, March 11, 2015
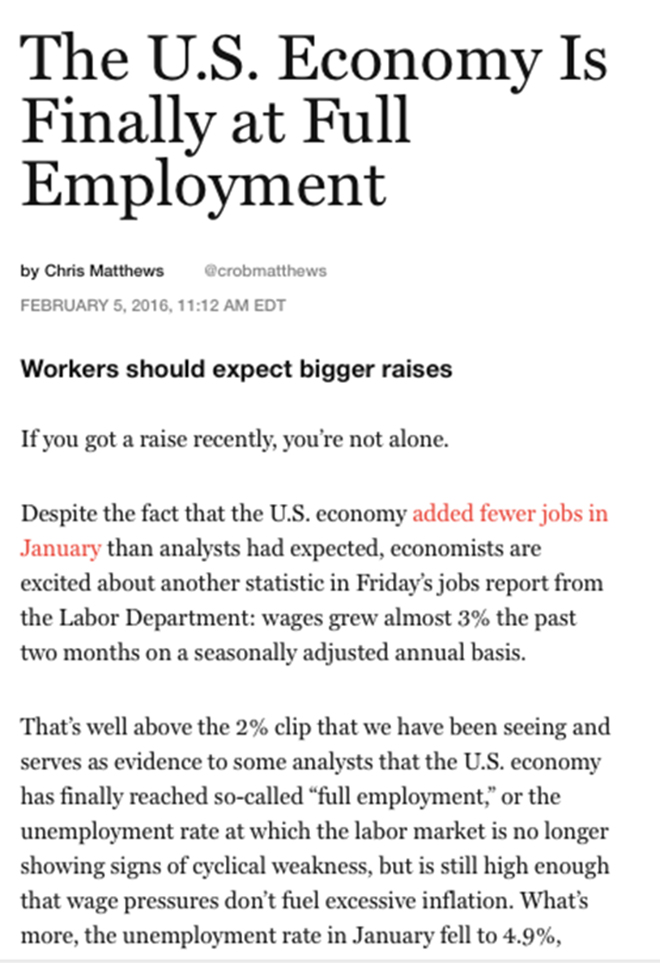
 Underemployment
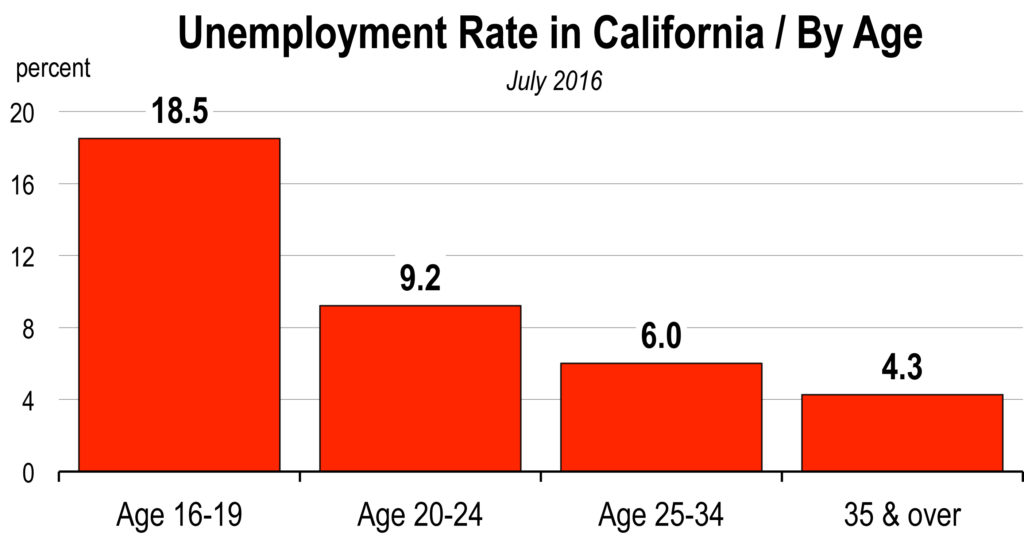
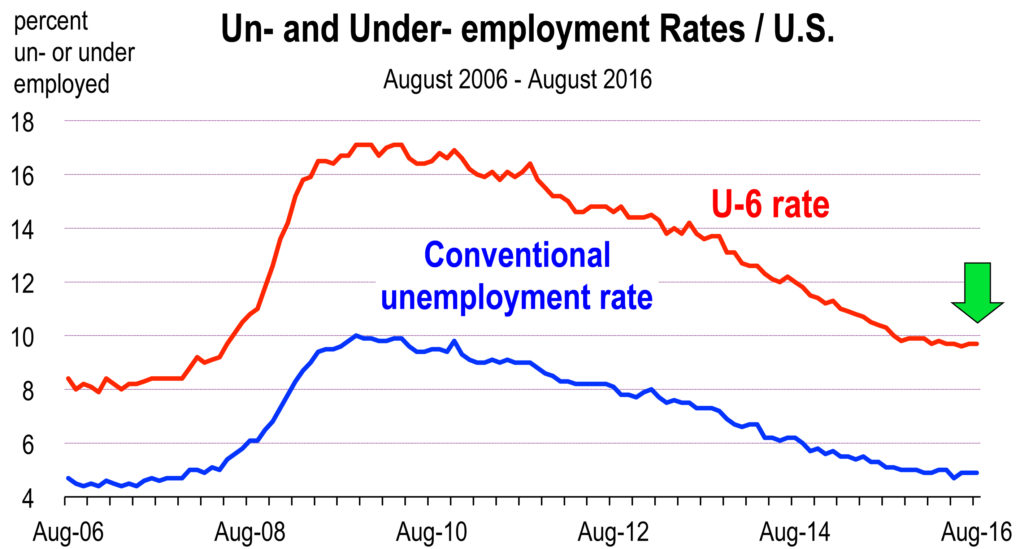 An alternative measure which seeks to explain underemployment is called the U6 unemployment rate. It expands the definition of the labor force to include “discouraged workers,” or people without jobs who have given up looking for work; “marginally attached workers,” or people without jobs who would like to work but have not sought employment recently, plus people employed part time (less than 35 hours/week) who would prefer to work full time.
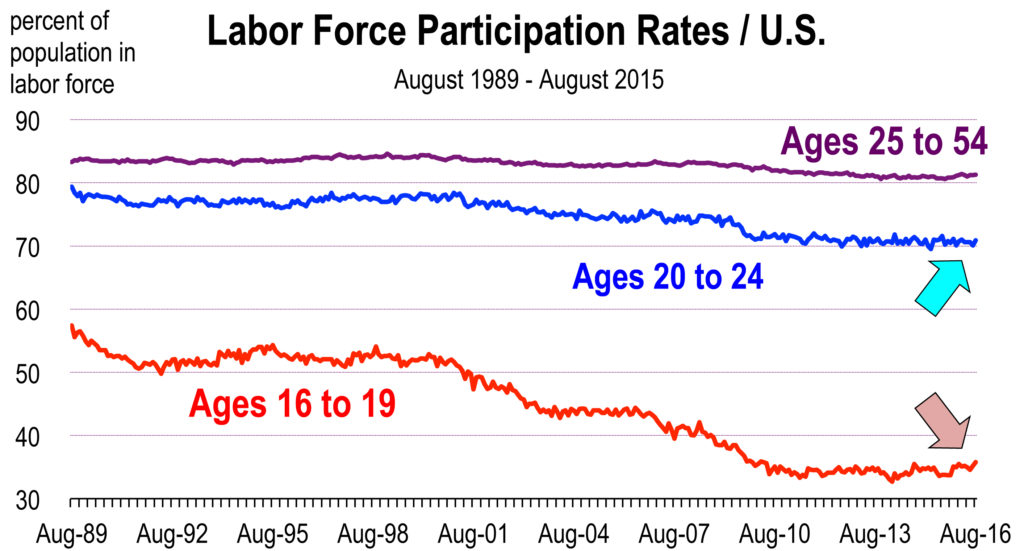 Furthermore, this age group has very low rates of labor force participation compared to the 25 to 54 year old age group. Attending high school, colleges and universities is a large reason for the reduced rates of participation, but does not fully account for the collapse in rates over time. All groups are showing a decline in labor force participation over time, but the younger age group participation rates have tumbled, whereas the 25 to 54 year old group is off only 3 percentage points from the all time record high of 84.5 percent reached in August 1997.
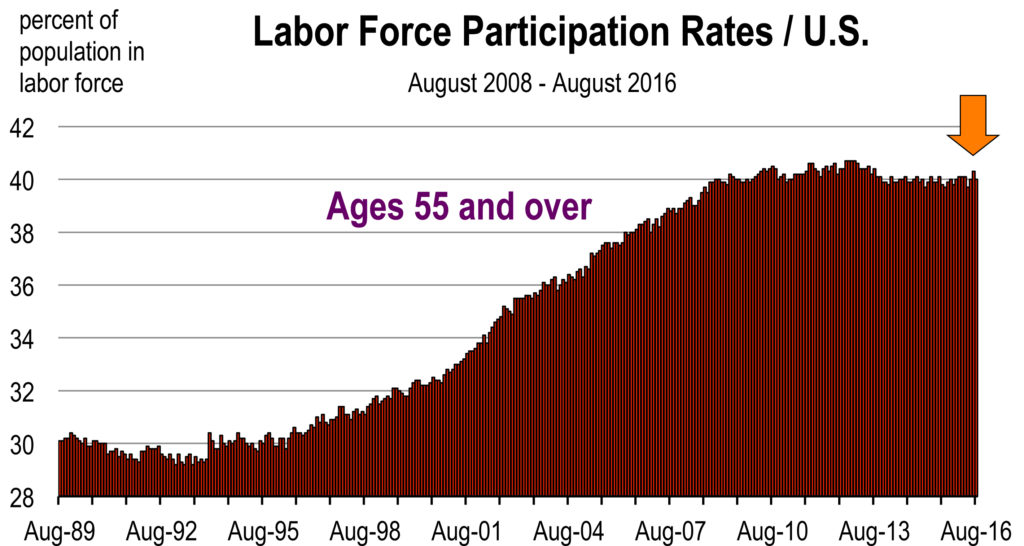 Conclusion
 Why Don’t We Deserve a Recession?
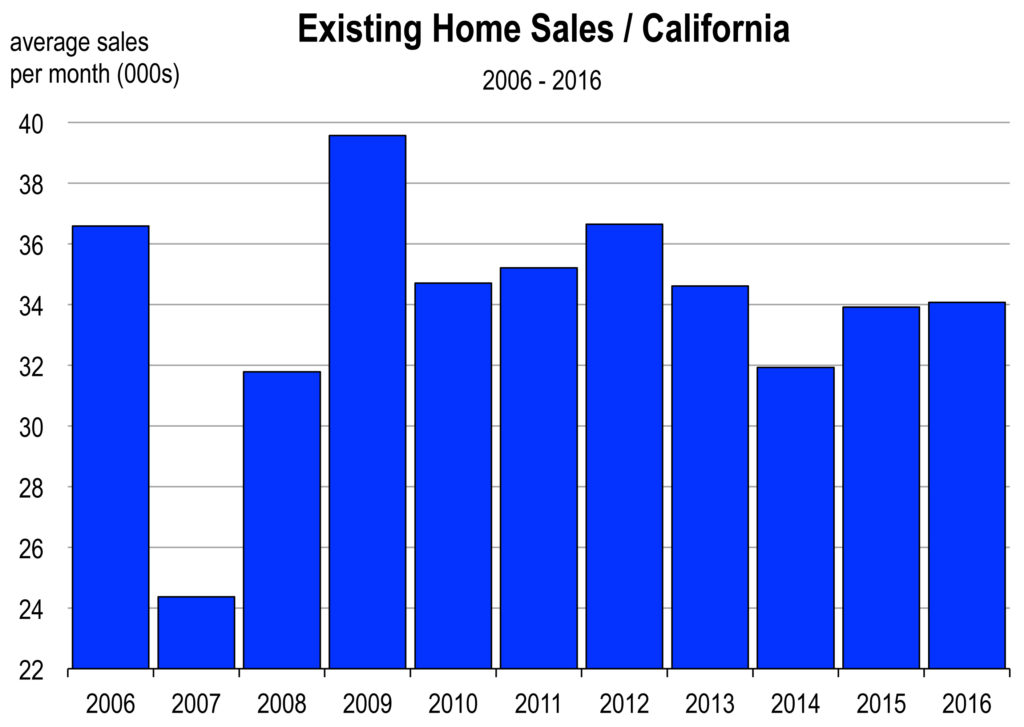 We have record stock market valuations because corporate profits have been strong, everyone’s working, inflation is contained, and the American economy is growing, relative to many of our global neighbors. The market is clearly not convinced that a recession is inevitable; otherwise stock prices would be eroding.
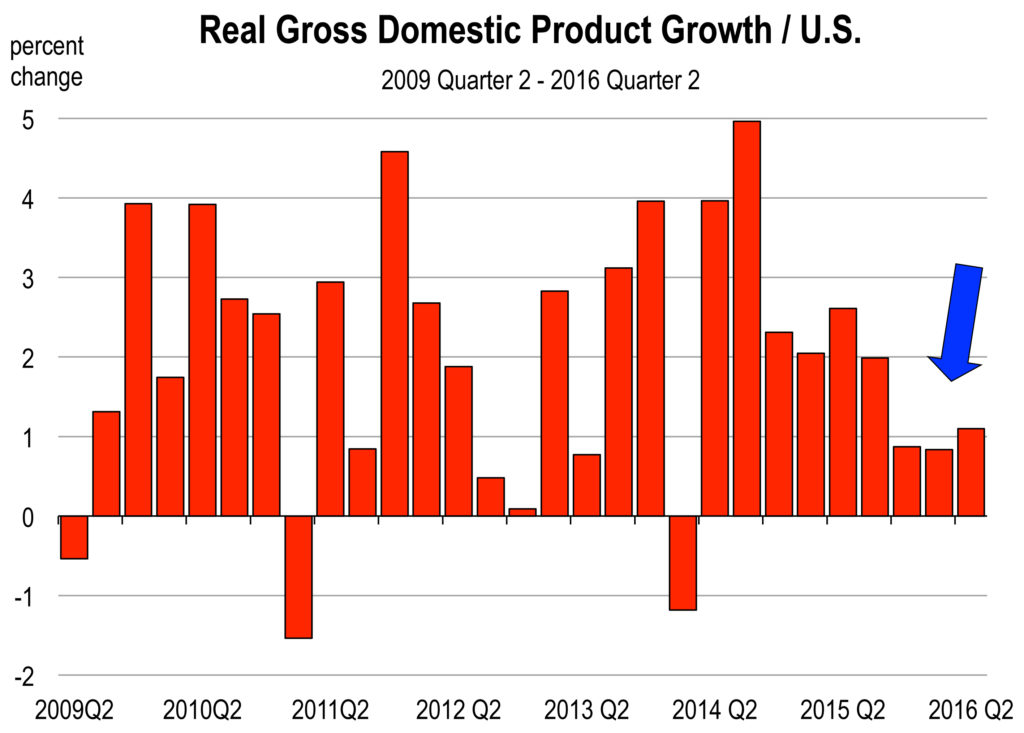 The upward movement of GDP this year has been stunningly slow, and is now running at a 1.5 percent rate of growth (we were in the mid 2s in 2014 and 2015). U.S. growth has historically averaged over 3 percent, and about 2 percent per year since the economy started growing again in mid-2009.
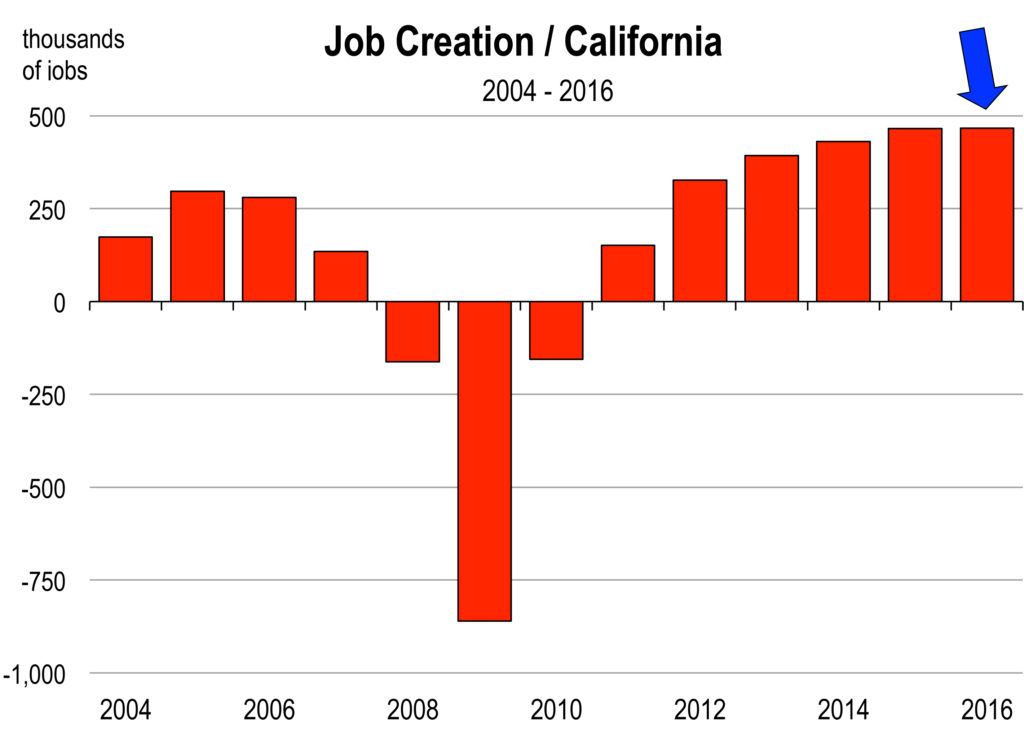 In California, 40,000 jobs were created in June. The pace of new job formation for 2016 to date will result in more than 470,000 new jobs this year, which is a remarkable accomplishment at this stage in the economic expansion.
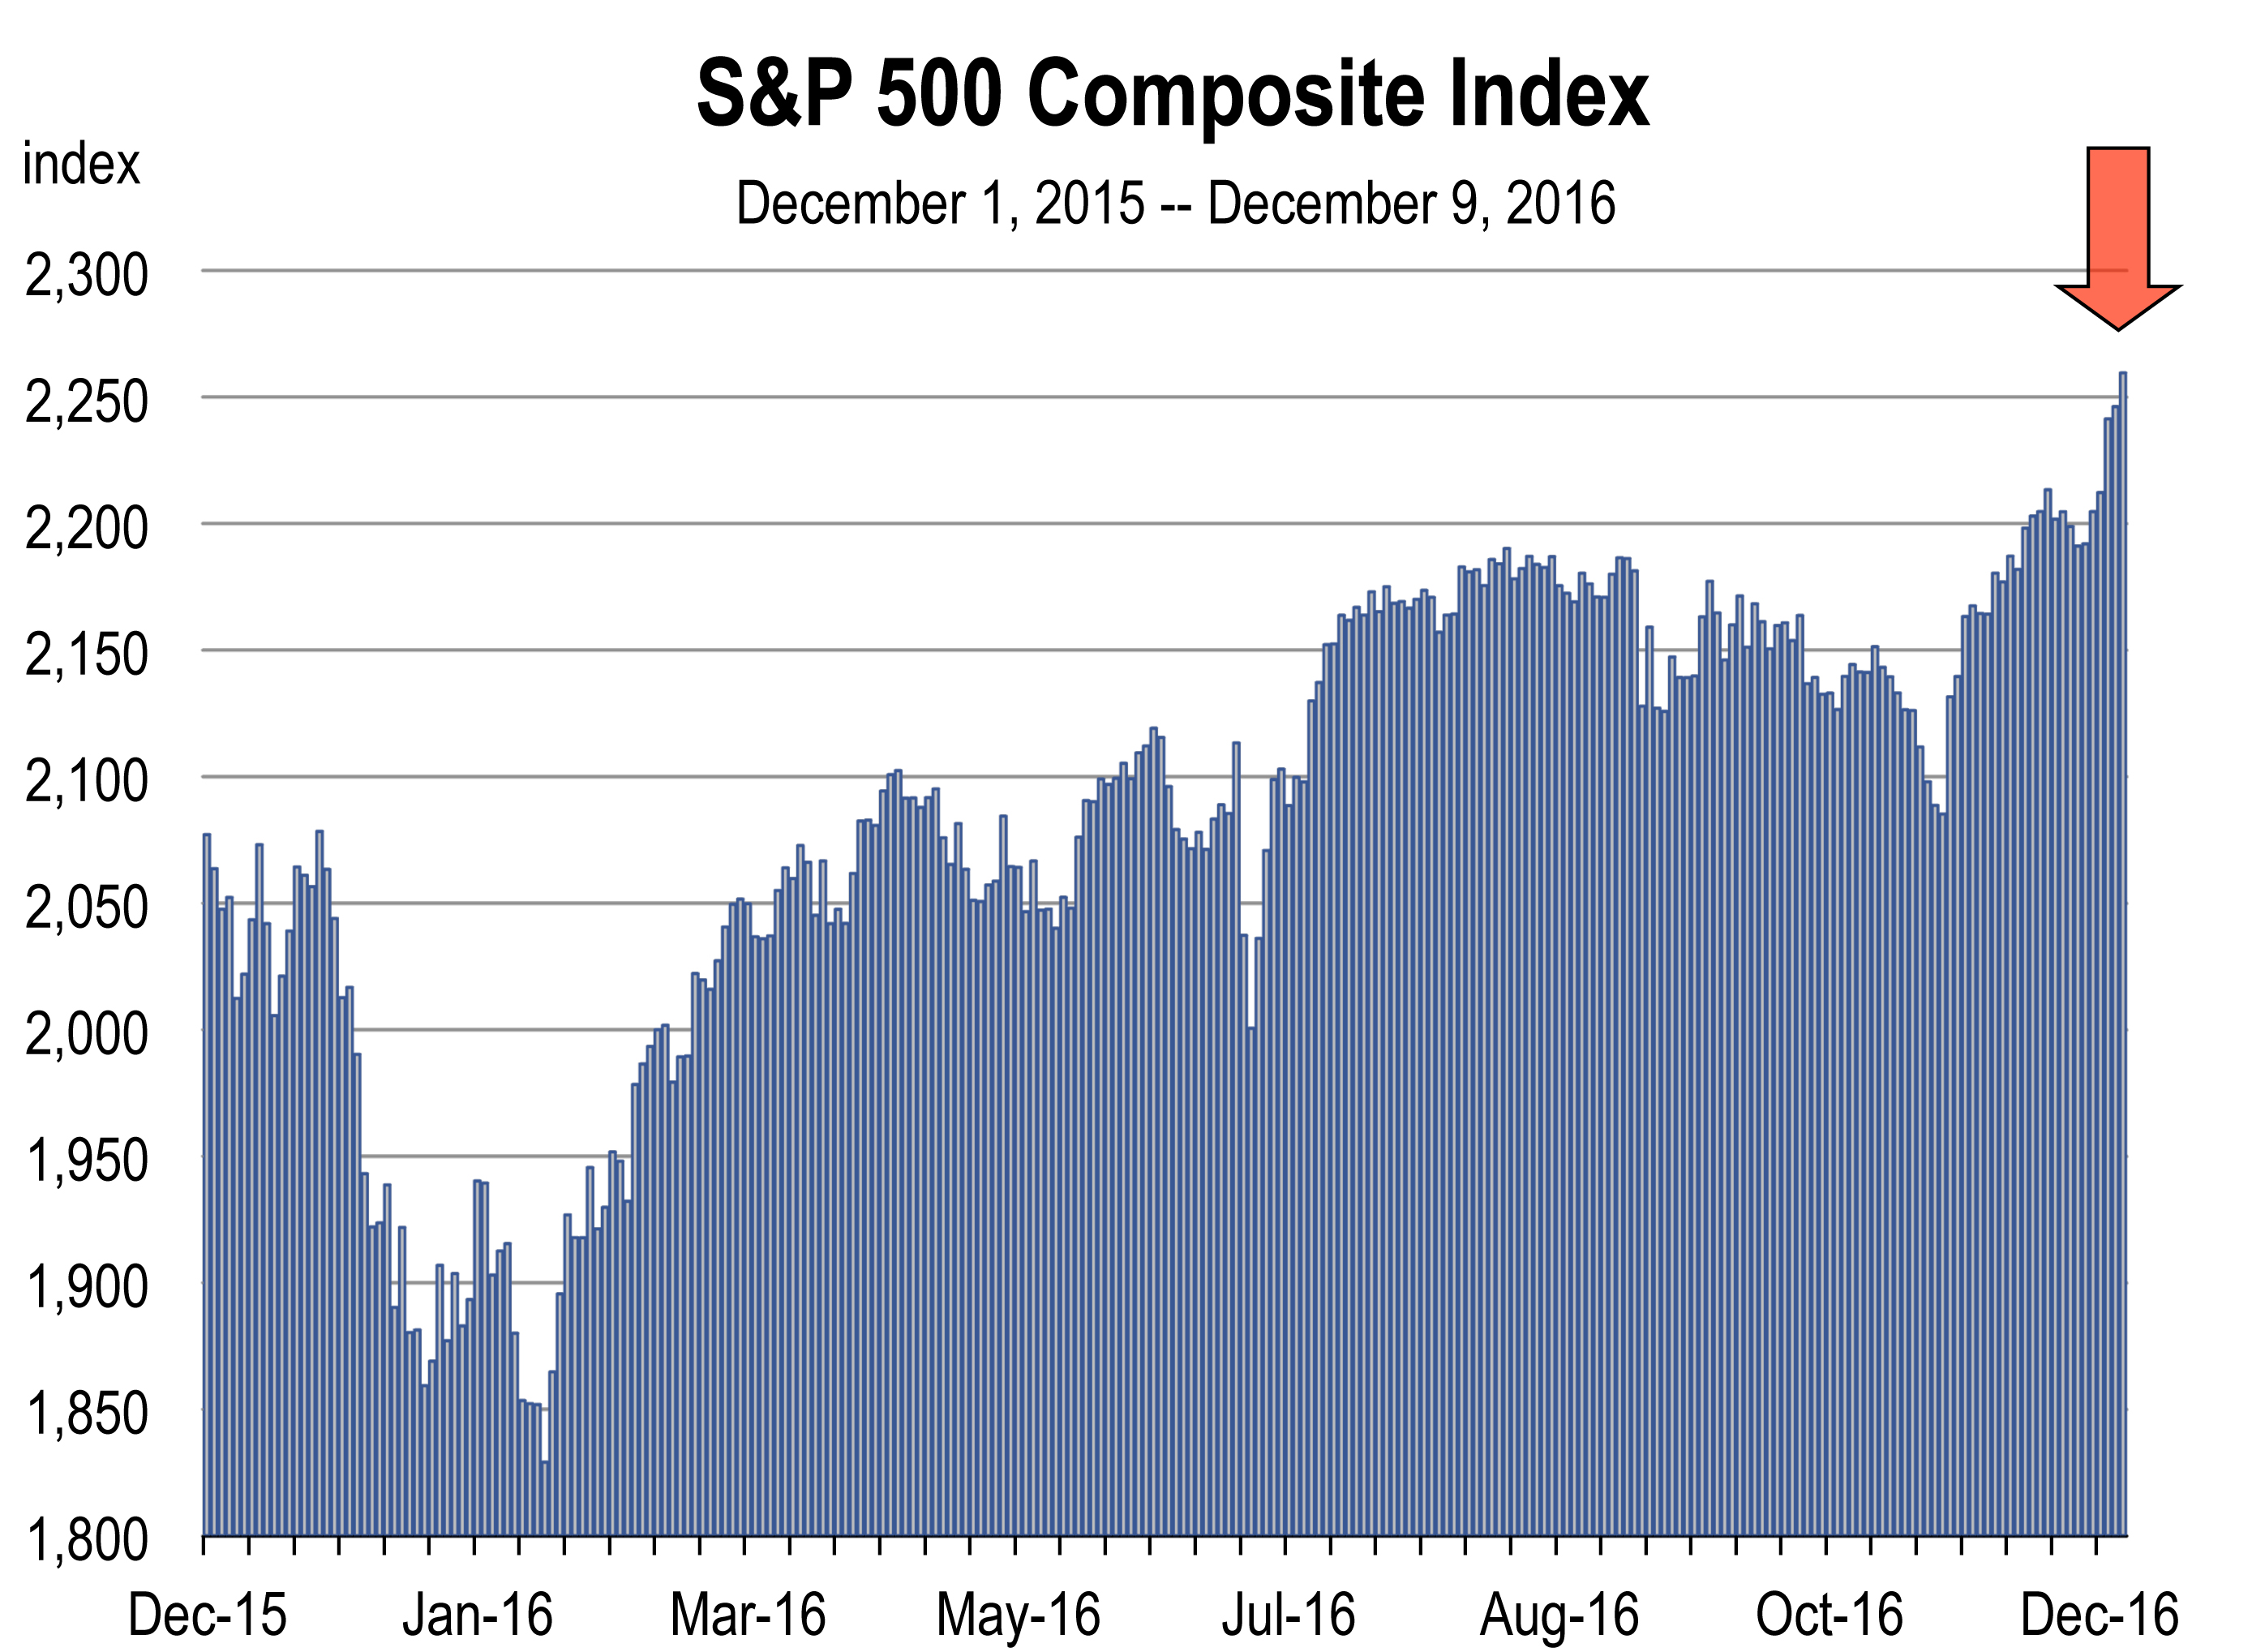
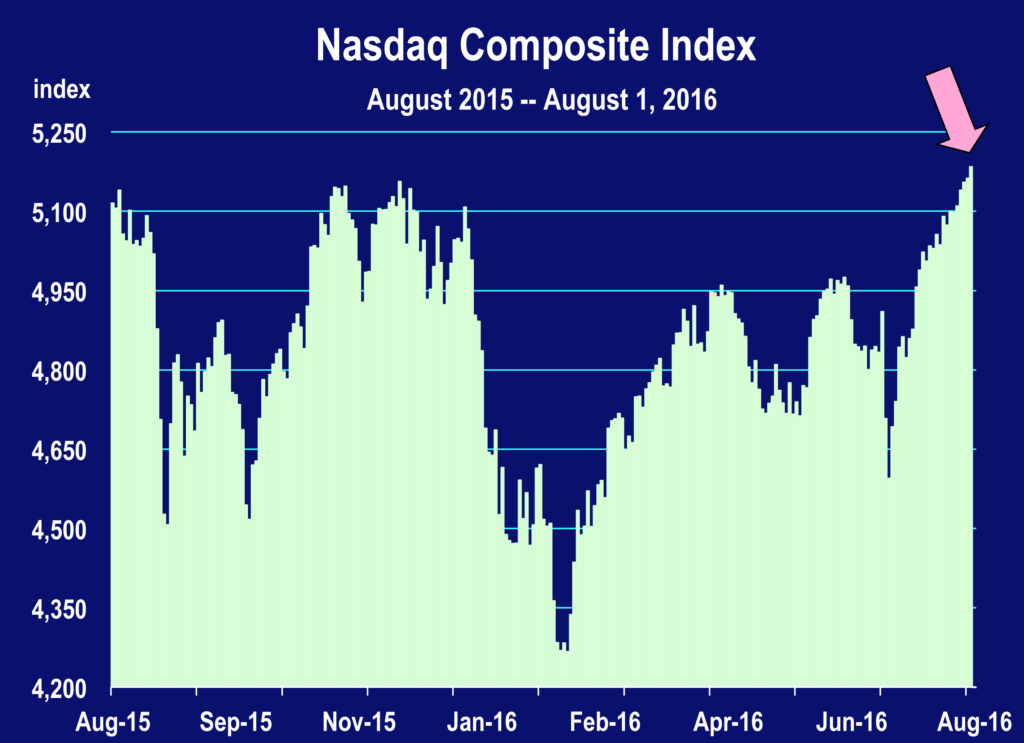
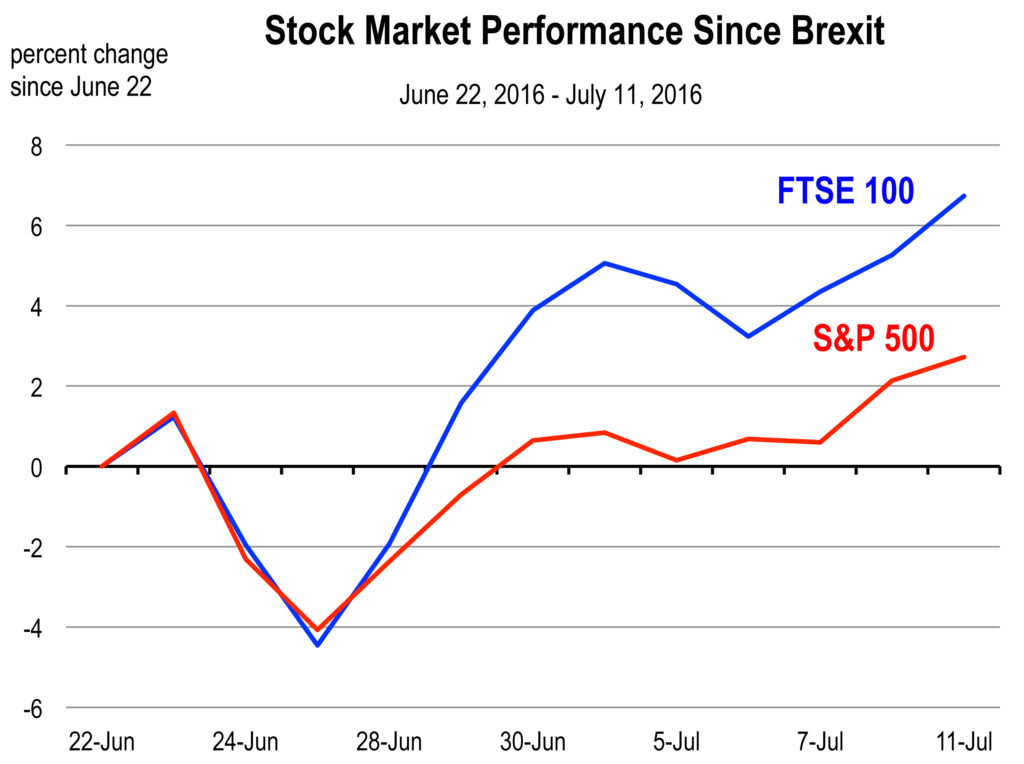 In the minutes and days after the vote, stock markets tumbled around the world. Bond yields fell and the Dollar strengthened as investors rushed to safe haven assets. This was a predictable reaction to a burst of uncertainty, but the turmoil has now subsided and markets have calmed. The S&P 500 has reached a new high, and the index of British blue chips has surpassed its pre-Brexit value by more than 6 percent.
 They were supposed to go higher in 2016—not sharply higher but noticeably higher nonetheless.
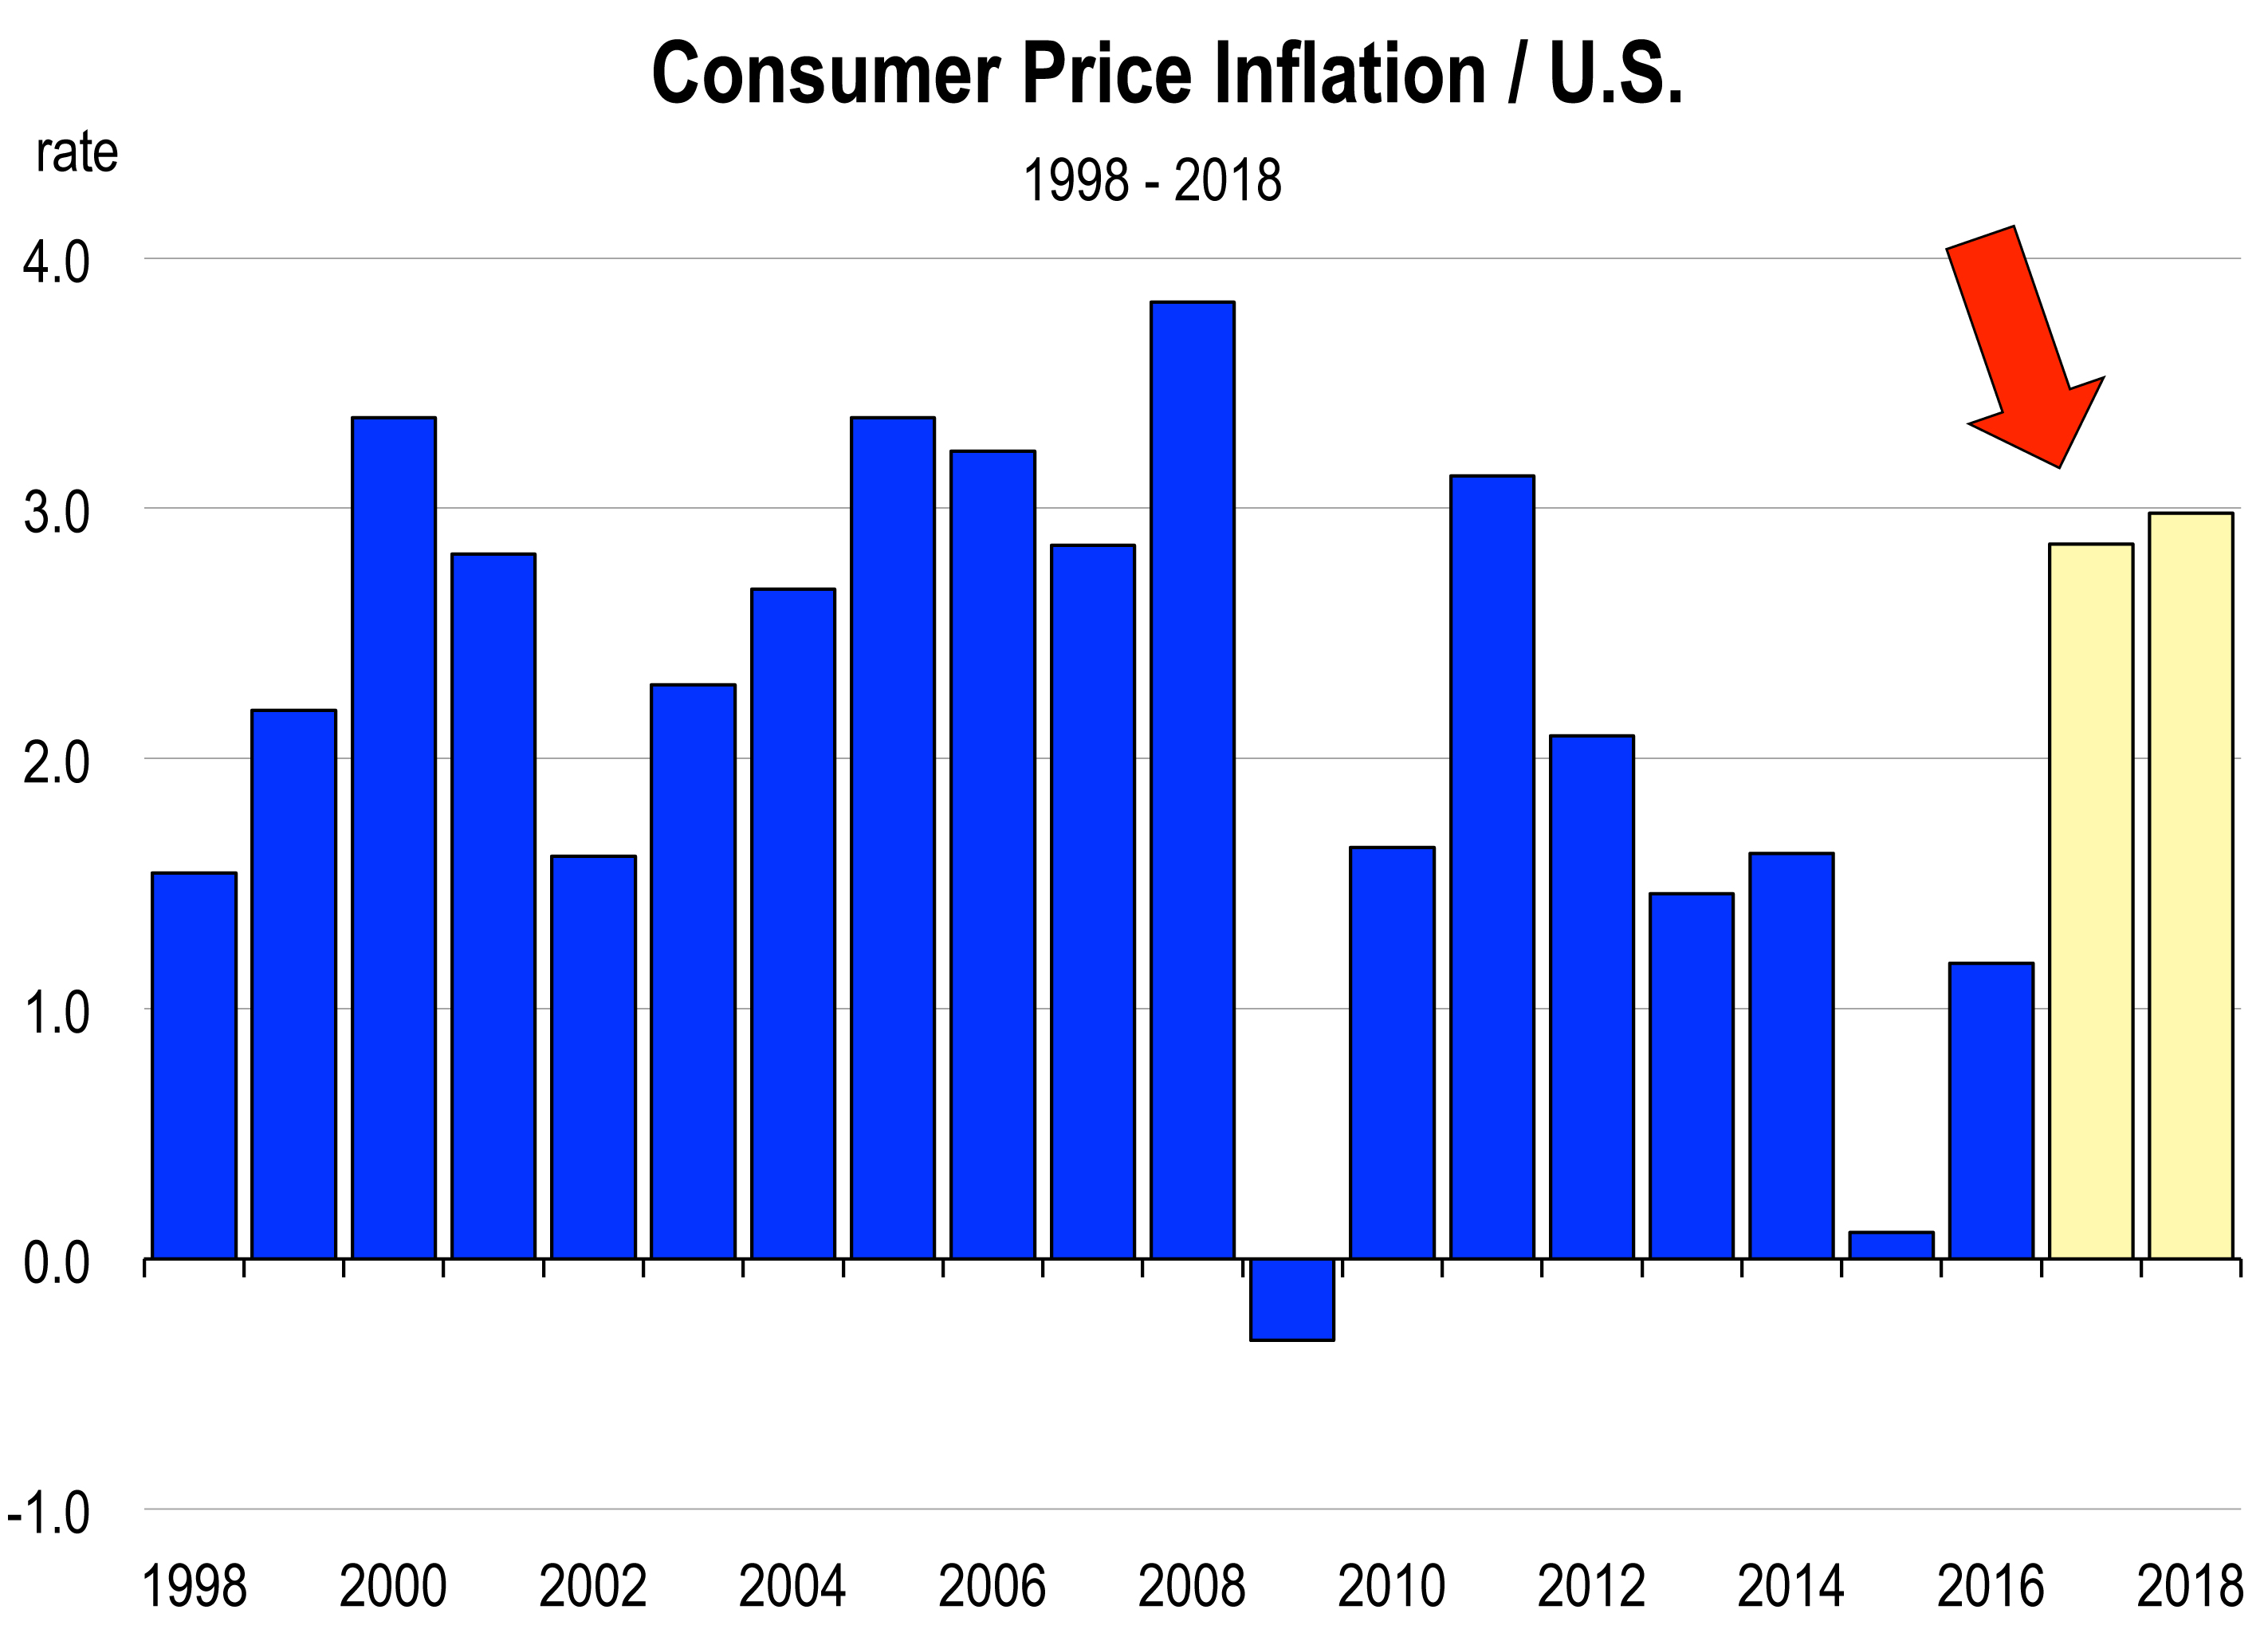
 With the economy on the verge of full employment, there is growing evidence of wage and salary inflation, and that will translate into higher general price inflation than what we observe today.
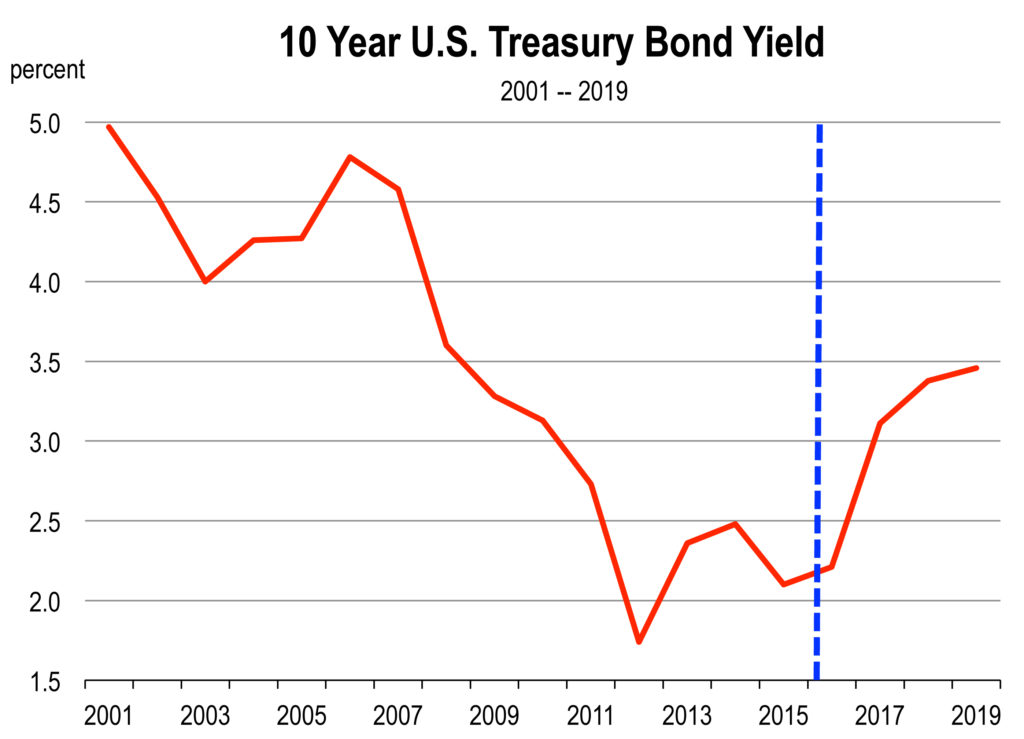
 Home prices continue to rise this year, especially in the California coastal markets. Home sales are running at a similar pace as last year—not too hot and not too cold.
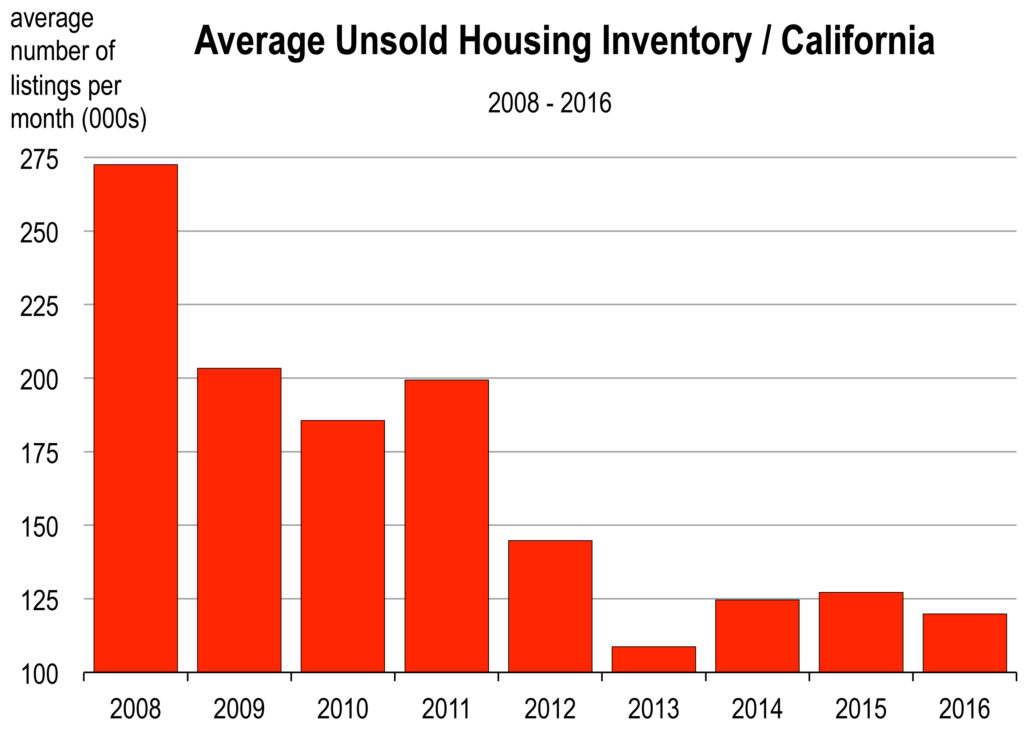 I have addressed the Millennials many times in these monthly reports. But let me reiterate what we are seeing or not seeing regarding them and the housing market:
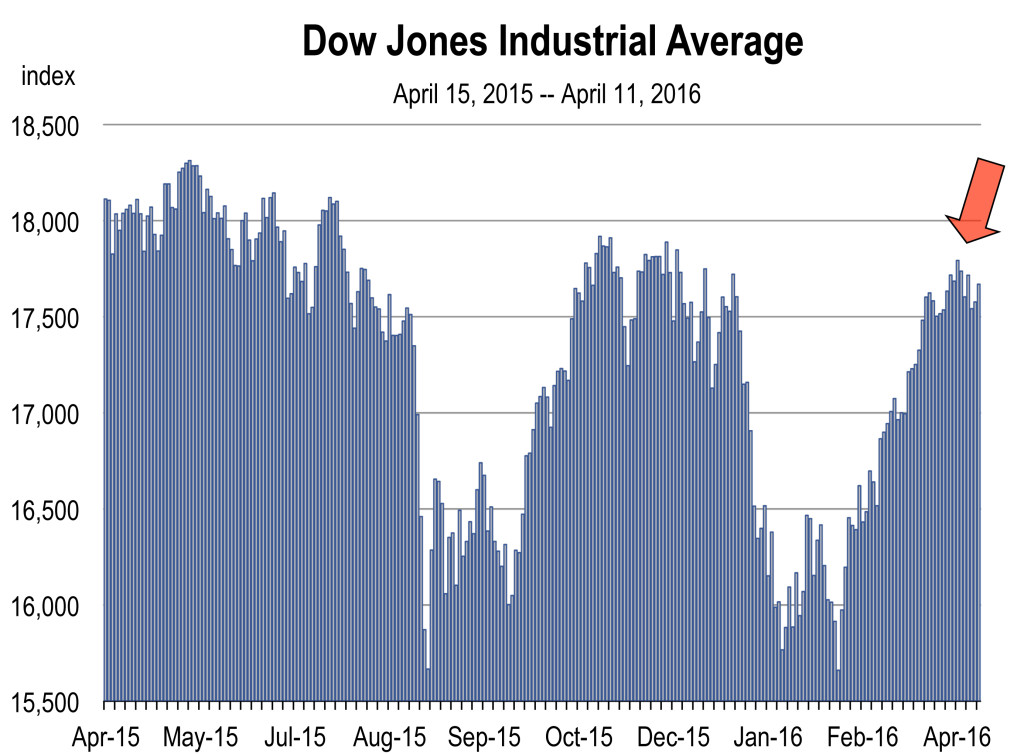 The Stock Market is Grinding its Way Back
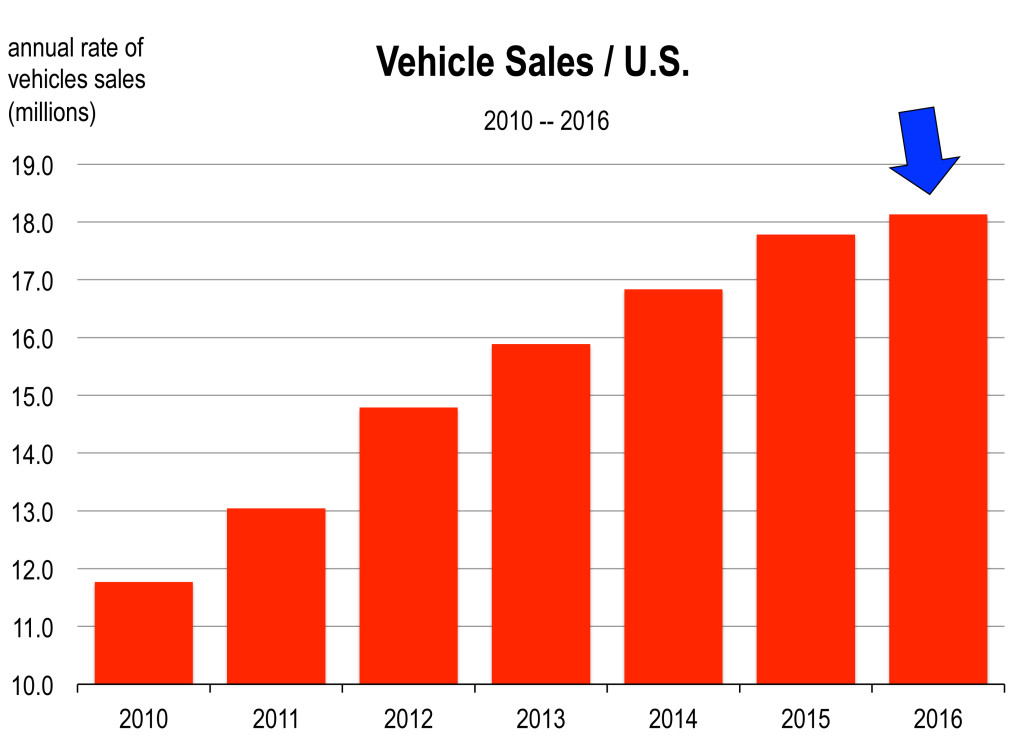 Americans are buying more cars at a near record pace. There are more vehicles on the road than ever before and traffic remains tough. The seasonally adjusted annualized pace of 17.5 million units in February was the strongest in 15 years. All the gains over the past year have been in the light truck segment thanks to persistently low gasoline prices.
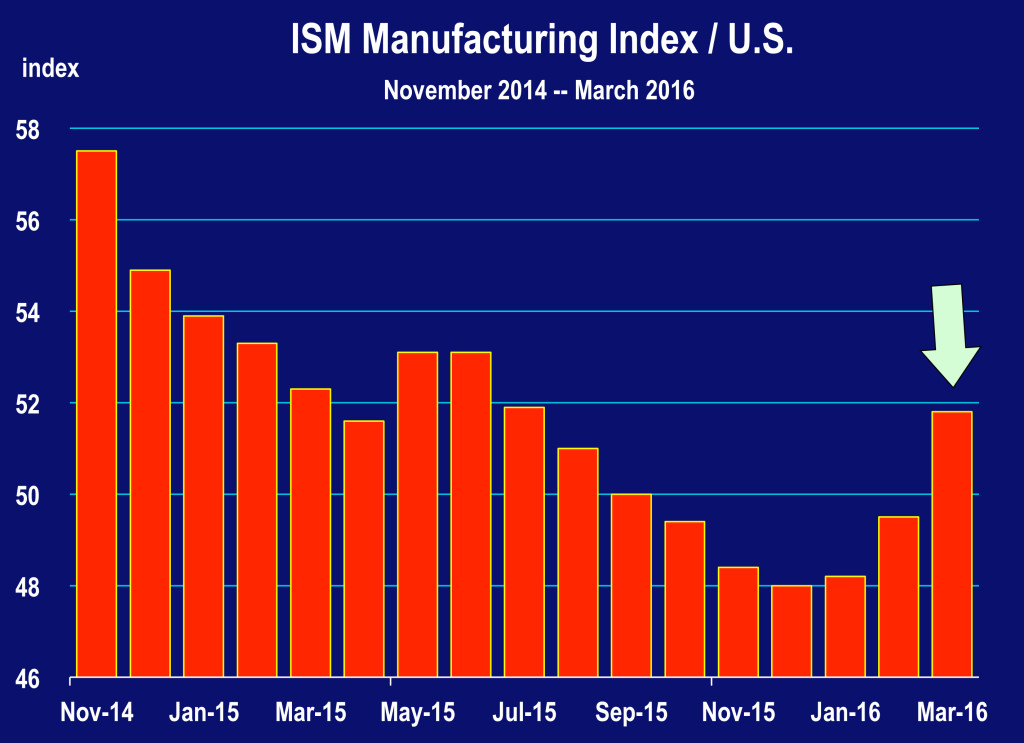 Manufacturing Rising Again
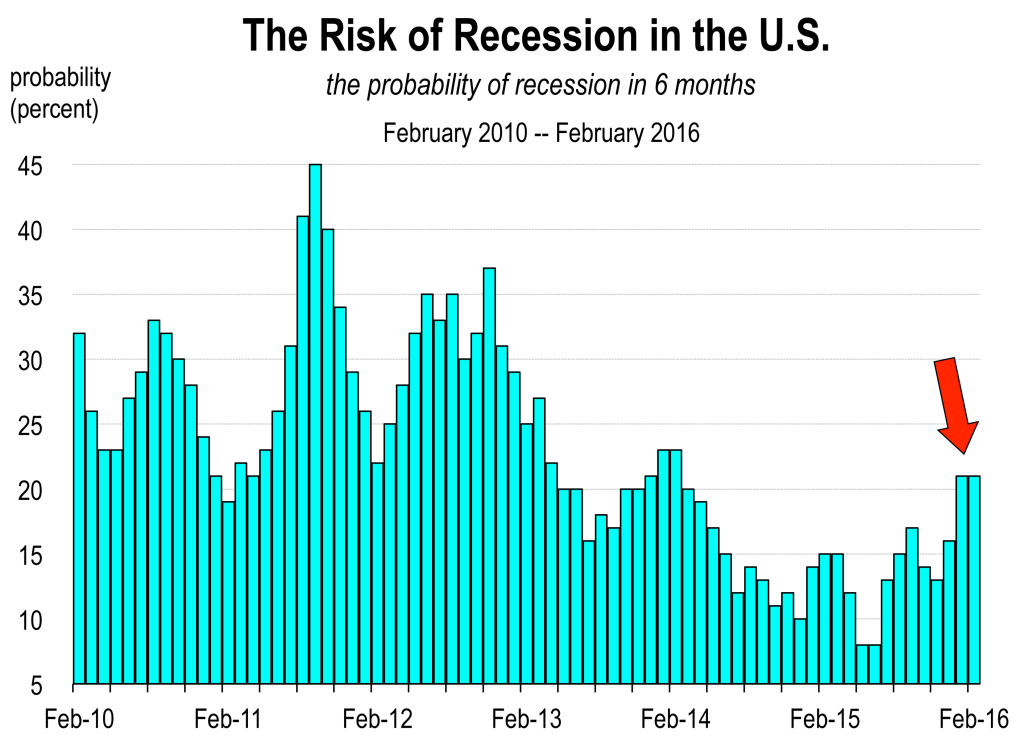 A higher stock market leads to more spending by consumers because of the wealth effect. Retail sales, which have been dragged lower in recent months by falling gasoline prices, should move higher going forward, especially as the U.S. economy approaches full employment and average earnings move higher.