


by Mark Schniepp
May 2016
Housing Market Update
 Home prices continue to rise this year, especially in the California coastal markets. Home sales are running at a similar pace as last year—not too hot and not too cold.
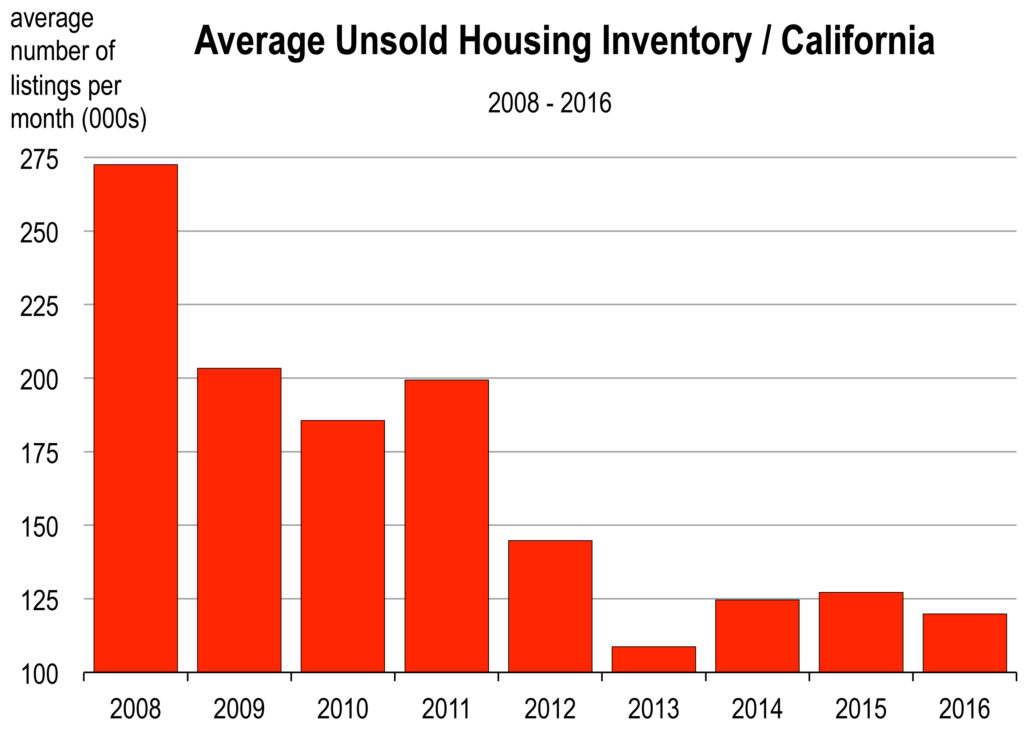
There is less inventory everywhere, and this includes new housing along with existing. The average number of years sellers owned their home before selling jumped to 10 in 2015—the longest period ever recorded from an annual survey that began 30 years ago.
Low housing inventory is the biggest concern among California realtors, followed by housing affordability.
There are more home buying age people than ever before, and most of them are employed and their wages or salaries are finally rising. Consequently, the labor market is at peak condition to be generating home buyers.
 I have addressed the Millennials many times in these monthly reports. But let me reiterate what we are seeing or not seeing regarding them and the housing market:
The percentage of first time home buyers has slipped to the lowest level since 1987 (28 years ago).
Home ownership for persons aged 35 and under is now at 34 percent, the lowest rate on record. Millennials clearly have decided that ownership housing is not yet for them.
And that’s because of the onerous student debt burden they carry, along with rising apartment rents which make saving for a down payment extremely difficult. And a larger downpayment is needed because housing values are at their highest levels since 2009.
Mortgage rates are still extremely low–like routinely under 4.0 percent for fixed rate loans—and more lenders are easing loan criteria.
However, these conditions are not necessarily producing a surge in demand for homes because the Millennial generation is not seeking ownership housing like past generations did at their age.
Consequently, if you suspect a housing market that is not quite as vibrant as you’d like it to be or as it might have been in recent years, that’s because there has been little improvement in the rate of sales, or the growth of inventory to sell.
| County | Region | Selling Price ($) | % Change |
|---|---|---|---|
| San Francisco | Bay Area | 1,360,600 | 6.7 |
| South Santa Barbara County | SoCal | 1,200,000 | -6.3 |
|
South Santa Barbara County (less Hope Ranch and Montecito) |
SoCal | 1,055,000 | 2.6 |
| Santa Clara | Bay Area | 1,065,000 | 14.3 |
| Alameda | Bay Area | 762,570 | 6.9 |
| Riverside | SoCal | 355,590 | 7.2 |
| San Bernardino | SoCal | 237,350 | 10.1 |
| Stanislaus | Central Valley | 262,390 | 8.3 |
| Contra Costa | Bay Area | 572,620 | 16.4 |
| Entire Bay Area | Bay Area | 761,170 | 4.2 |
| Fresno | Central Valley | 230,880 | 7.9 |
| Napa | Bay Area | 666,670 | 18.5 |
| Orange | SoCal | 721,140 | 3.6 |
| San Joaquin | Central Valley | 297,370 | 9.1 |
| San Diego | SoCal | 573,580 | 8.1 |
| Ventura | SoCal | 620,020 | 3.9 |
|
Source: California Association of Realtors, Santa Barbara Association of Realtors |
Higher end properties are not being purchased as much this year as last. That may involve the stock market, which has moved upward since January 2016, but has made no net improvement over the last 12 months, or since May of 2015.
Is the Market at the Top Yet, for this Economic Cycle?
I don’t believe there has been any top in the real estate market yet. At least not regarding transactions. Home prices should continue to move higher, albeit at a slower pace than what we’ve observed since 2012. Low inventory because homeowners are not selling, and low demand from the Millennial generation make this real estate market very different from past ones.
It appears that for the short term, more of the same is the most likely direction for the housing market.
The California Economic Forecast is an economic consulting firm that produces commentary and analysis on the U.S. and California economies. The firm specializes in economic forecasts and economic impact studies, and is available to make timely, compelling, informative and entertaining economic presentations to large or small groups.
![]()