Cracks in the Economy and the Next Recession

by Mark Schniepp
February 2019

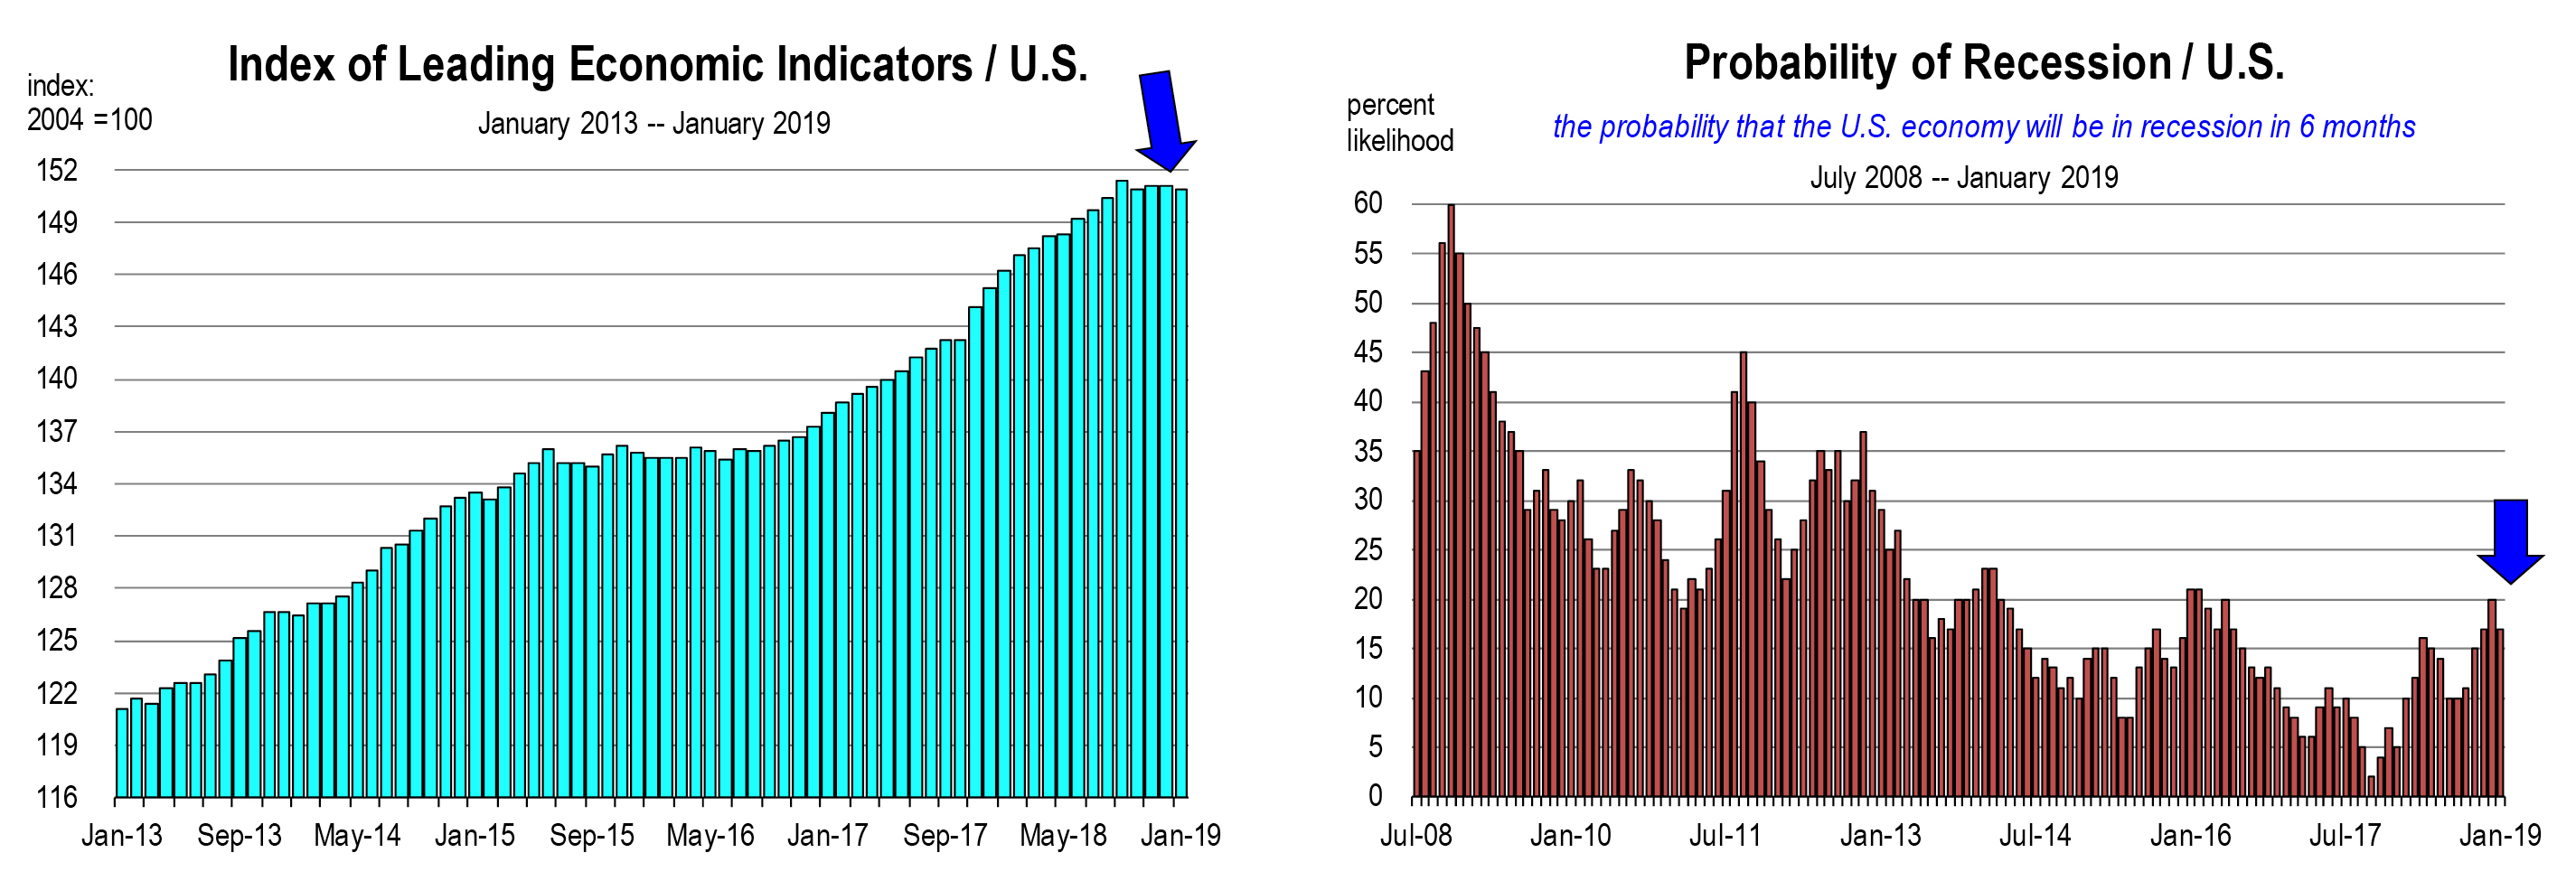
Last month I presented the outlook for 2019 and a recession was not part of it. Now just to be clear, a recession is coming, not this year but early in the next decade. It’s unknown what event or issue will serve as the tipping point, but any one or combination of conditions could weaken the economy and make it vulnerable to a downturn in growth.

The candidates I’ve been watching closely are:

  • The headwinds in retail
  • The trade wars
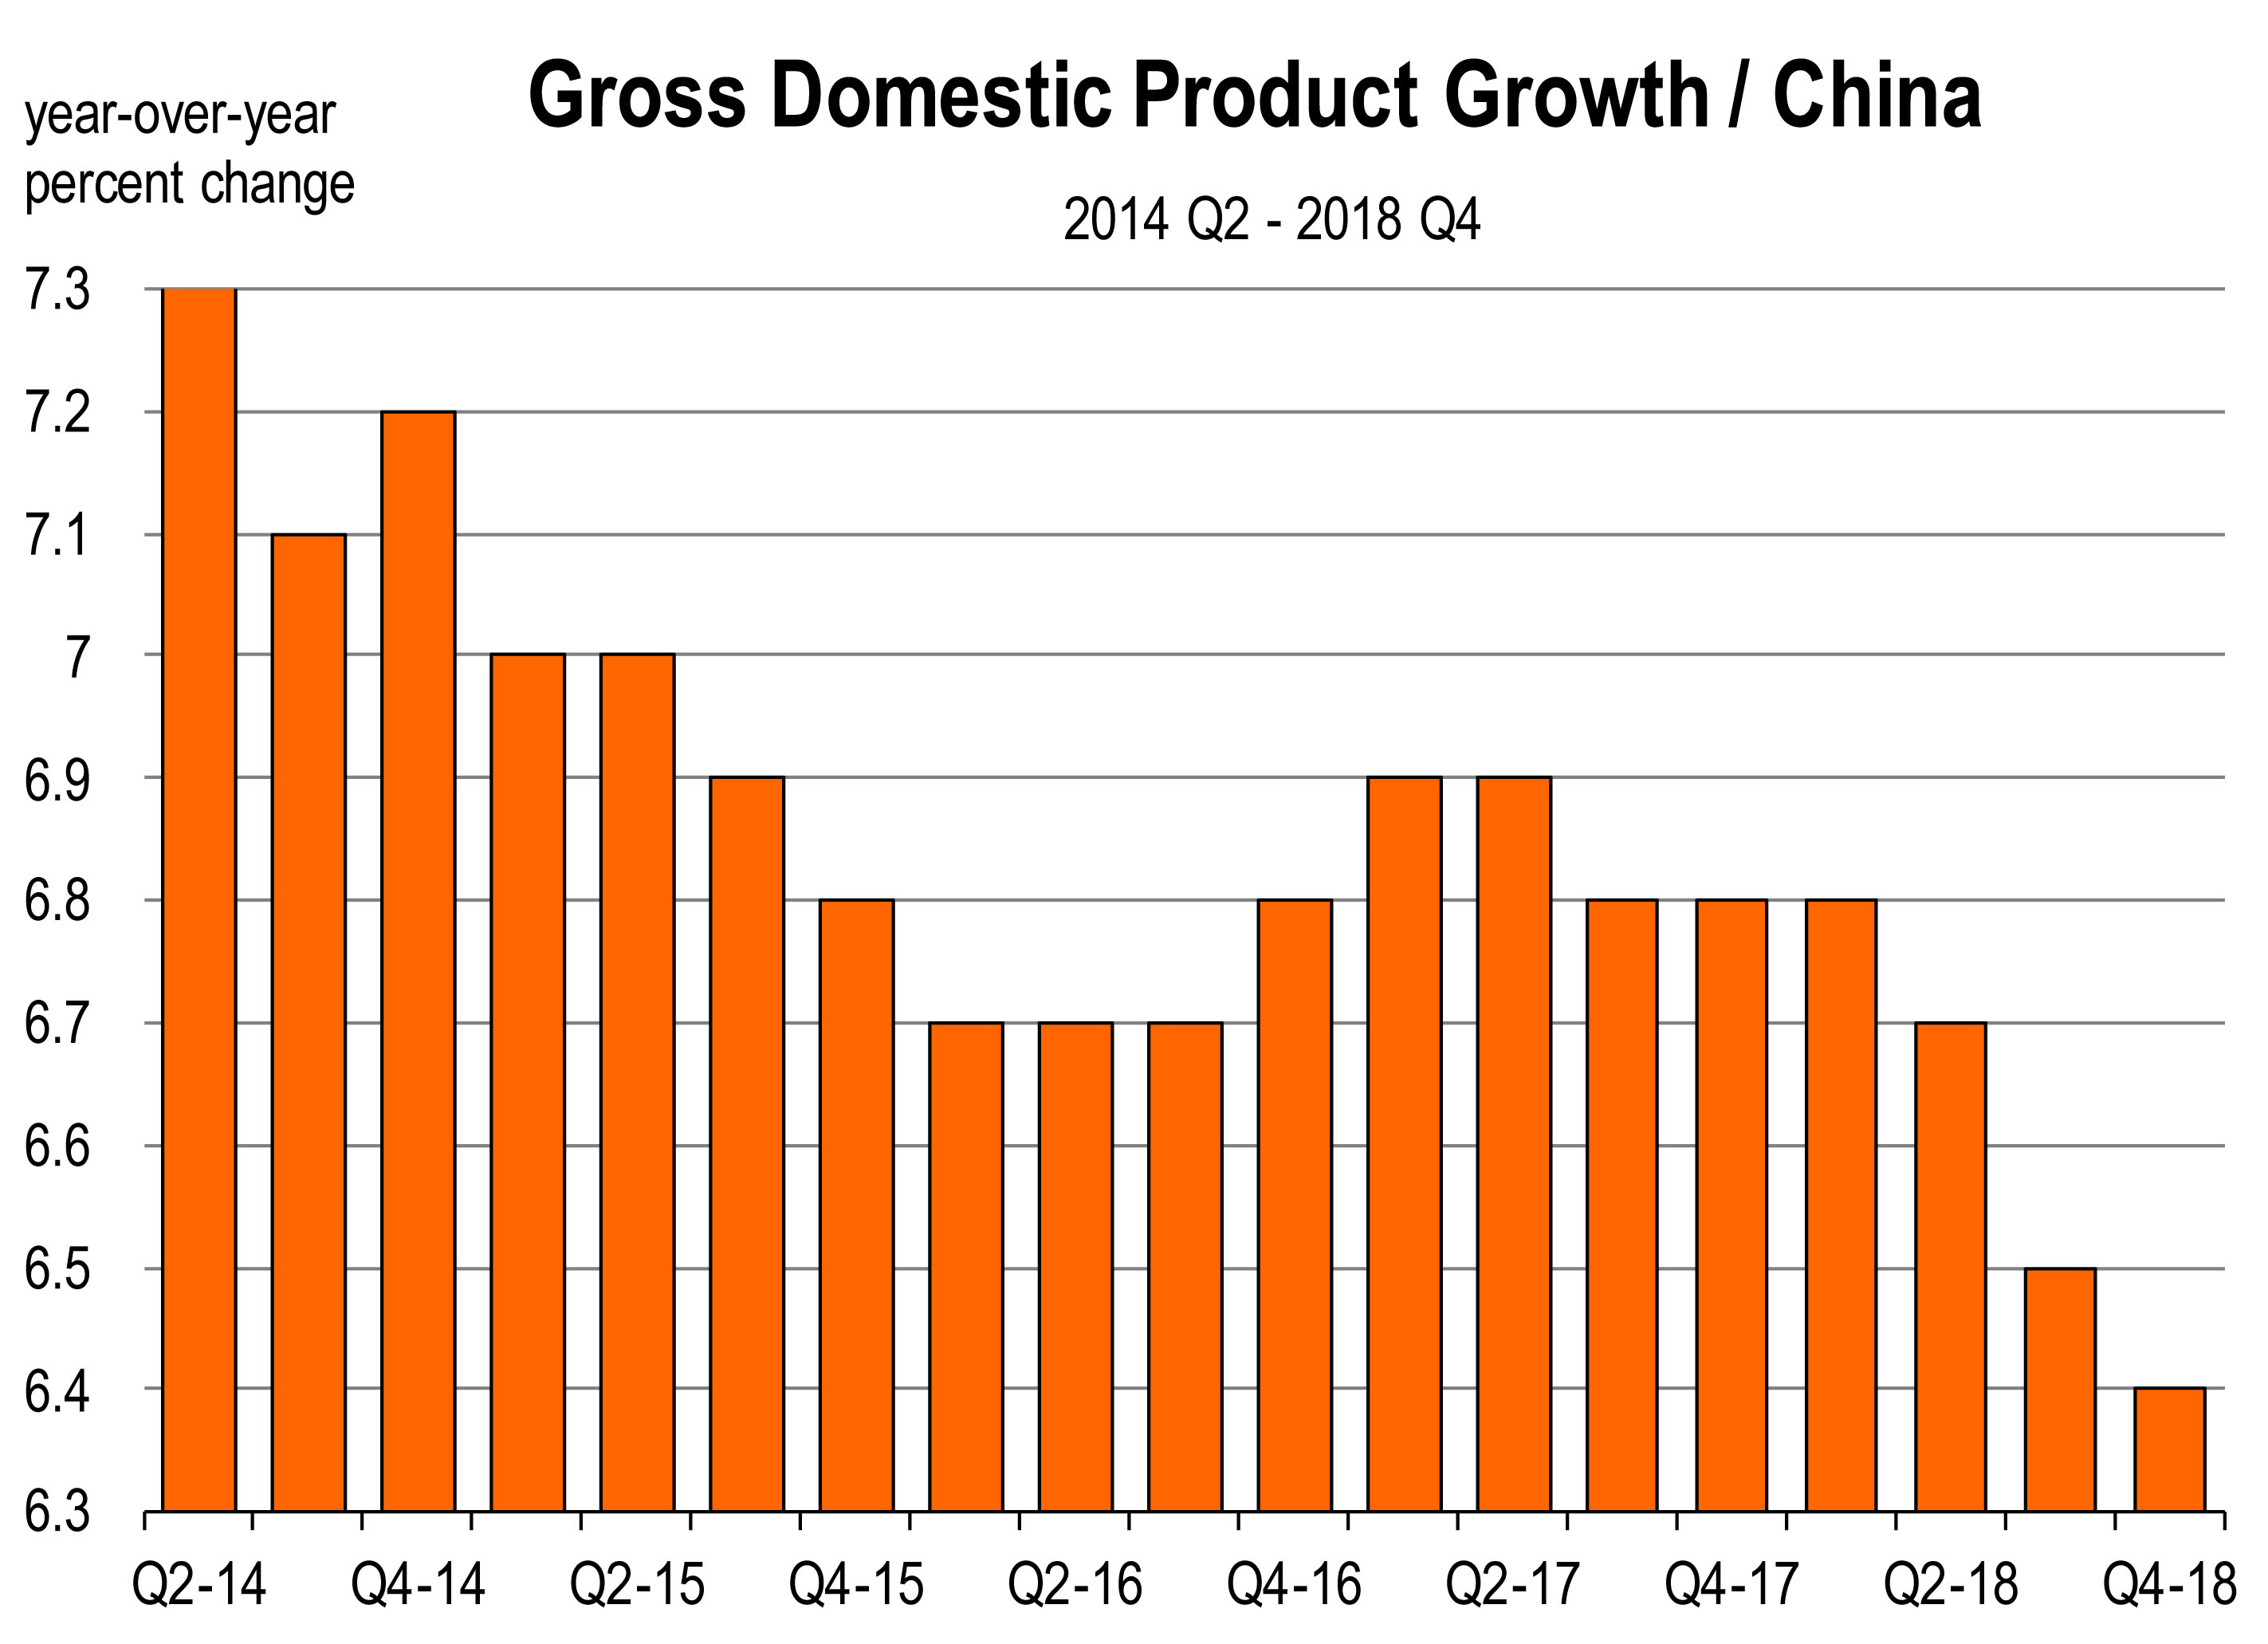
  • Slowing GDP growth in China
  • The stock market correction
  • Faltering home sales
  • Interest rates, and
  • Credit spreads

Warning Signs

The Trade war has affected both agriculture and some manufacturers.

General Motors announced in December that it was slashing production at American factories. GM pointed to tariffs on steel and aluminum in its recent decision to close several factories and cut thousands of jobs.

The recent sell-off in the stock market was the sharpest since September 2011. The tech giants (Facebook, Amazon, Alphabet (Google), Apple, and Netflix have lost nearly a trillion dollars in market value since September.

The turbulence is perhaps an early warning sign by investors who are worried about the sustainability of current economic growth in view of

  1. Fed interest rate policy, and
  2. A noteworthy deceleration of the Chinese economy

Apple is cutting iPhone production to China, due to a weaker economy there. This is a bellwether sign. China is the third largest market for Apple, behind the U.S. and Europe.

Furthermore, tight labor markets are pushing wages and salaries higher, and this is impacting corporate profitability. Profitability reduces earnings, and lower earnings result in lower stock prices. Lower stock prices reduce household wealth and I’ll discuss that further below.

The Retail Sector

Consumer behavior is changing and the way we buy goods is going through a dramatic shift. Retail real estate is desperately trying to adapt with the departure of department stores and malls now renting to big box tenants. There are more restaurants, office users, and recreational activities in traditional retail spaces. Empty space is not necessarily piling up. There are many new retail successes among the growing wave of failures. It does not appear that the so called “retail apocalypse” by itself will crash the system.

Trade Wars

Reportedly, China is willing to resolve trade disputes with the U.S. A ceasefire on further tariffs is currently underway as agreements on trade issues are being negotiated. Though the trade war is a problem for U.S. exporters and it’s a red flag for the economy right now, I’m not too worried that the trade war will remain a growing problem that could lead us into recession.

Housing

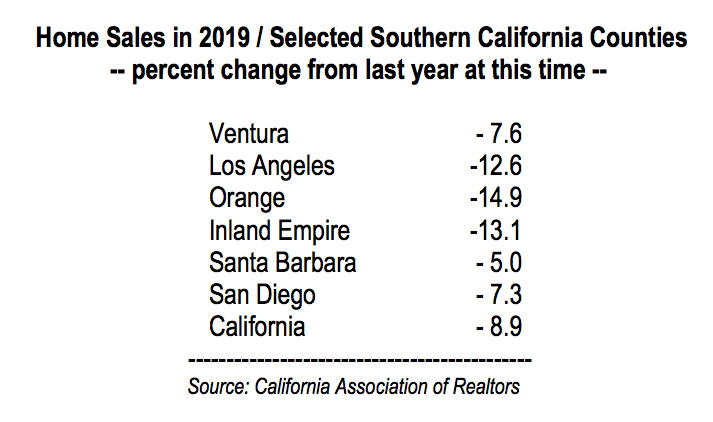
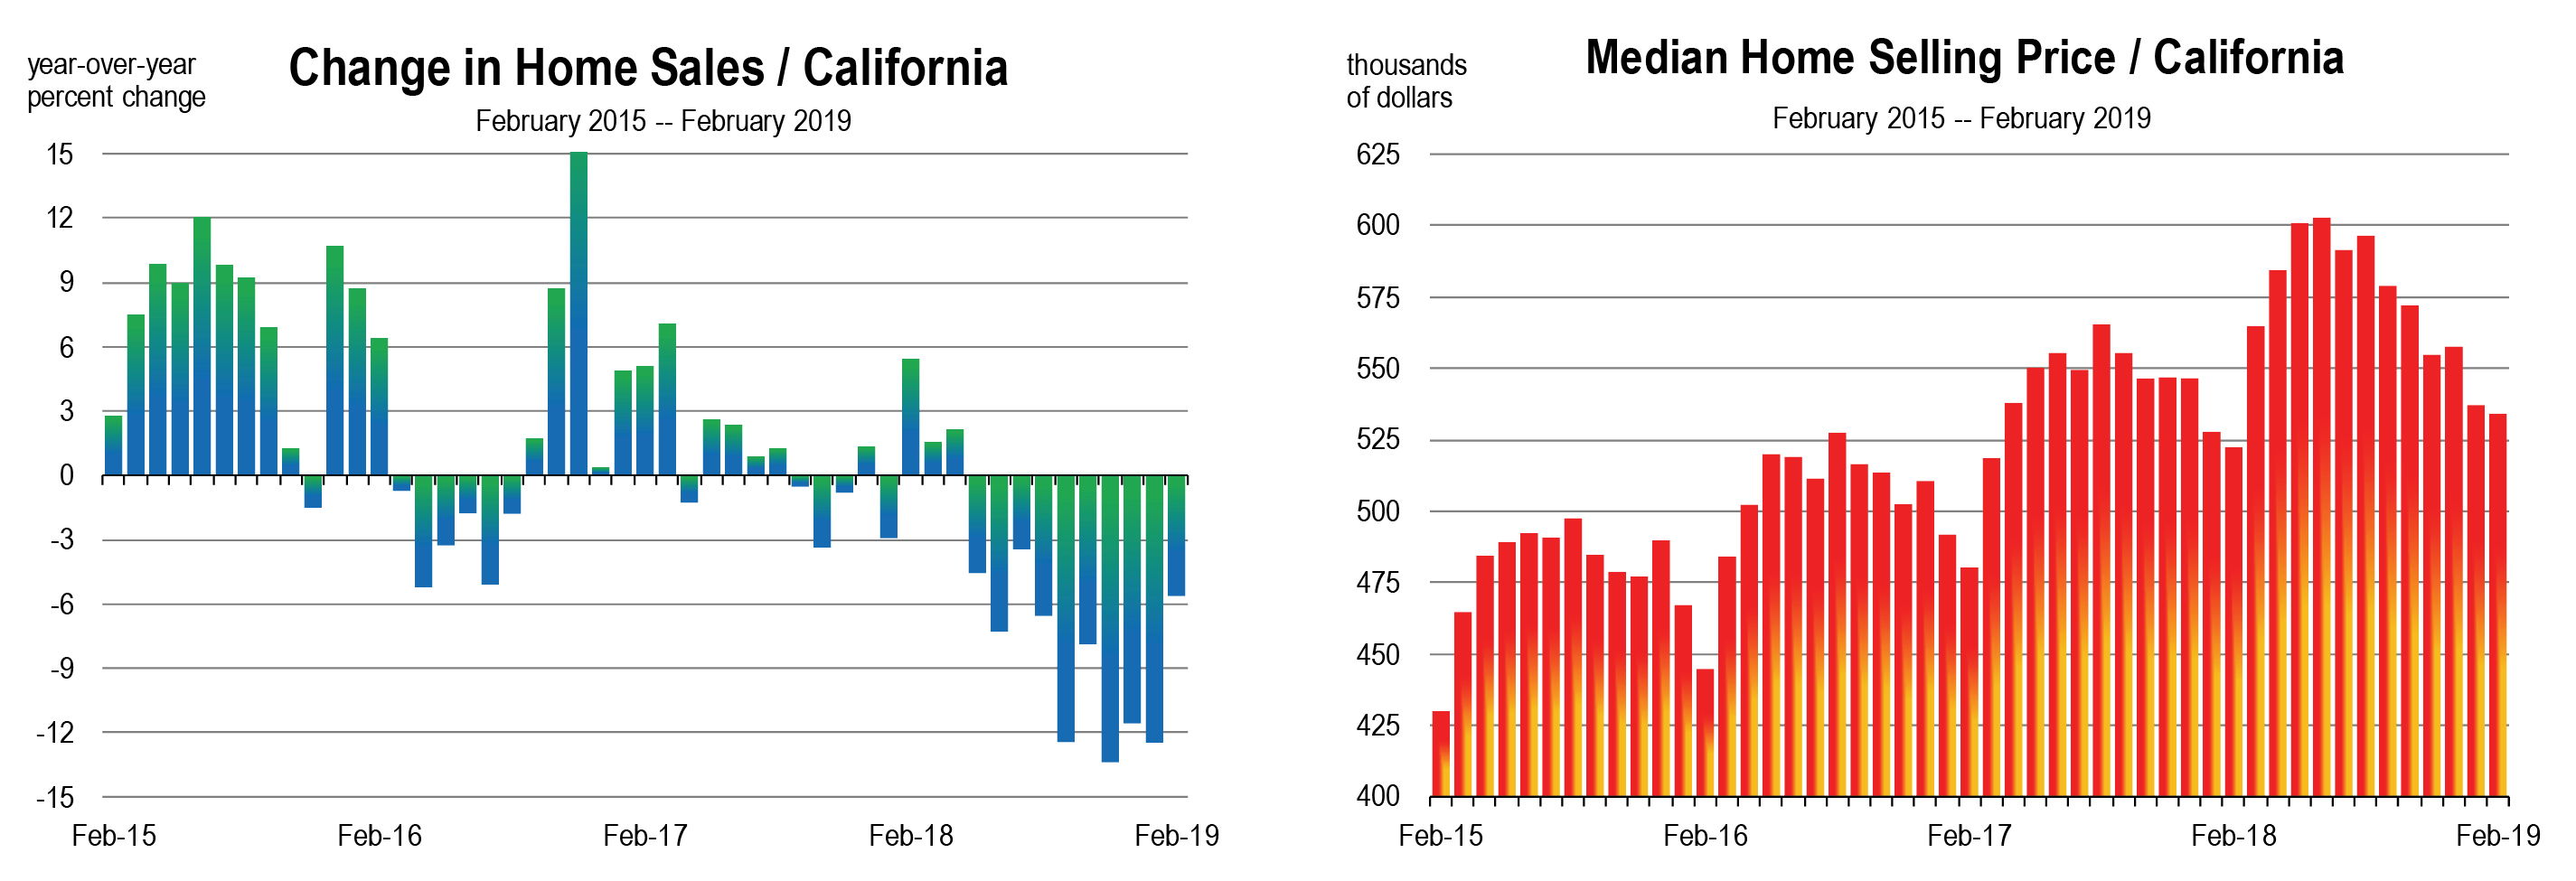
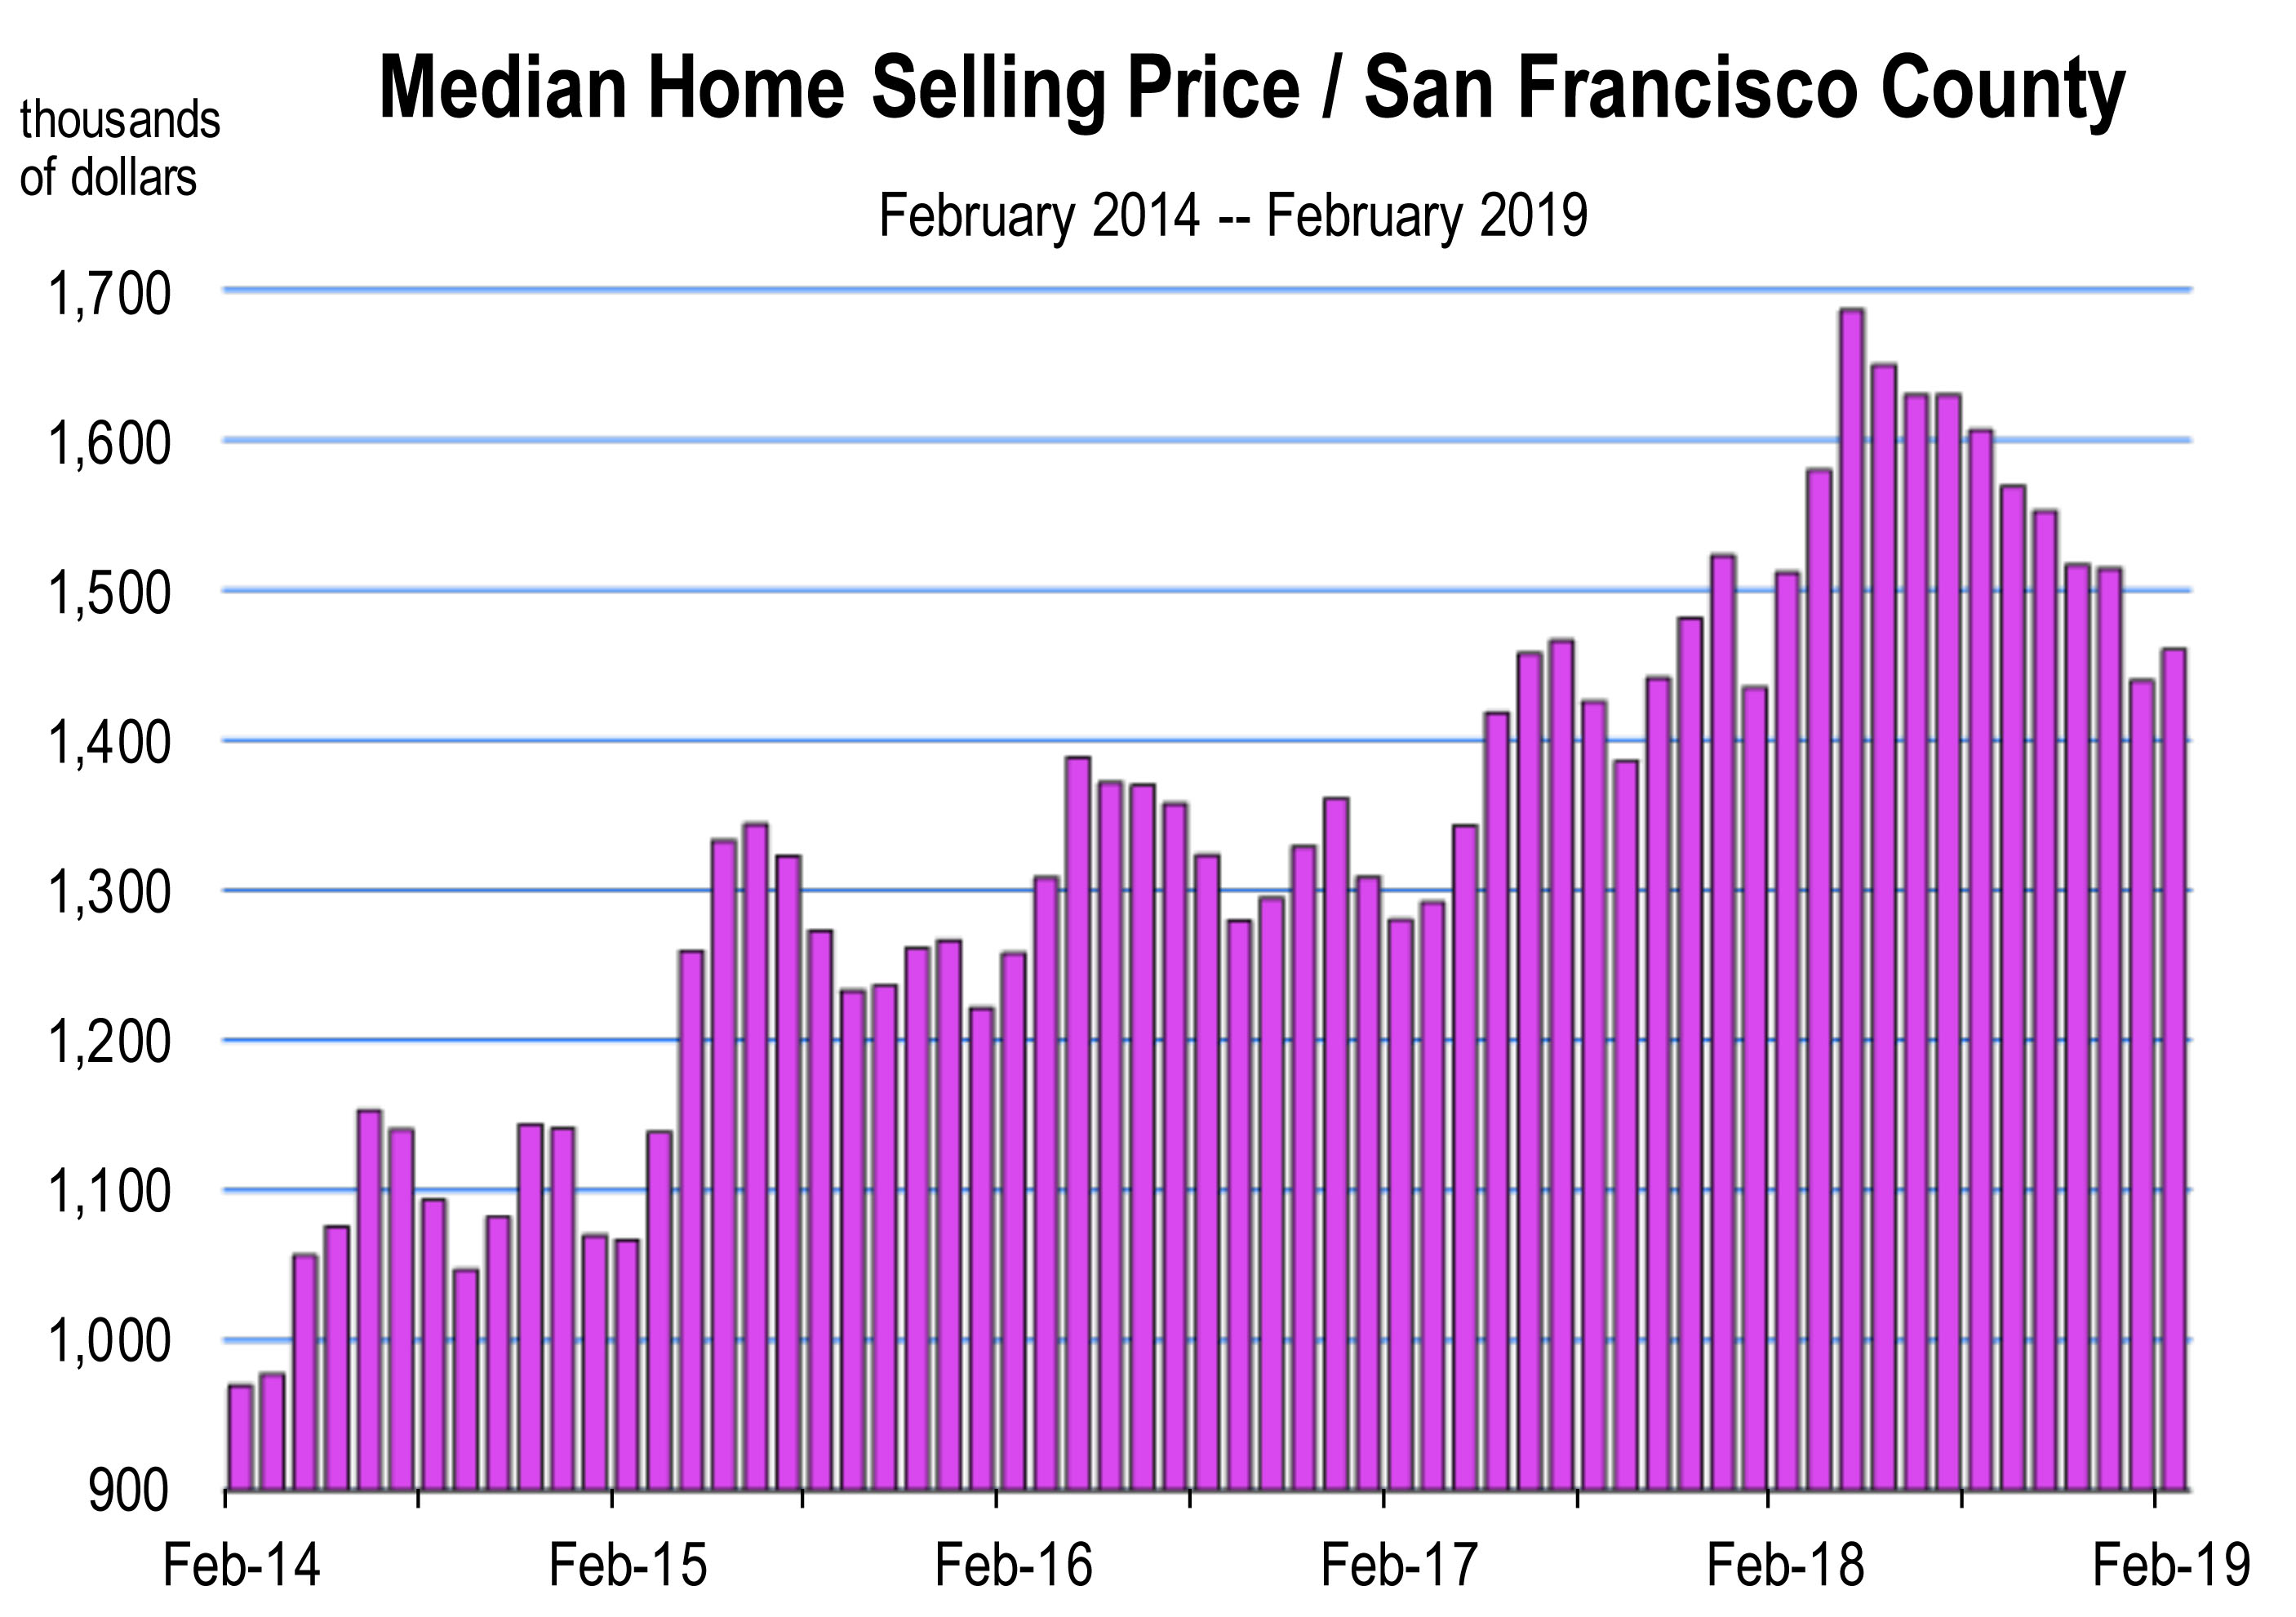
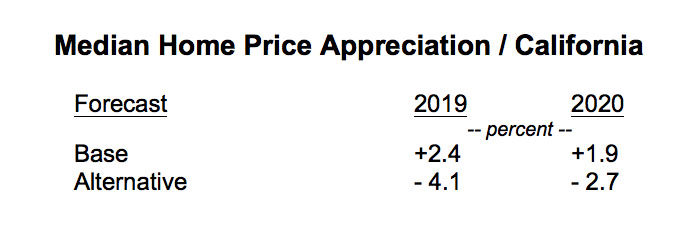
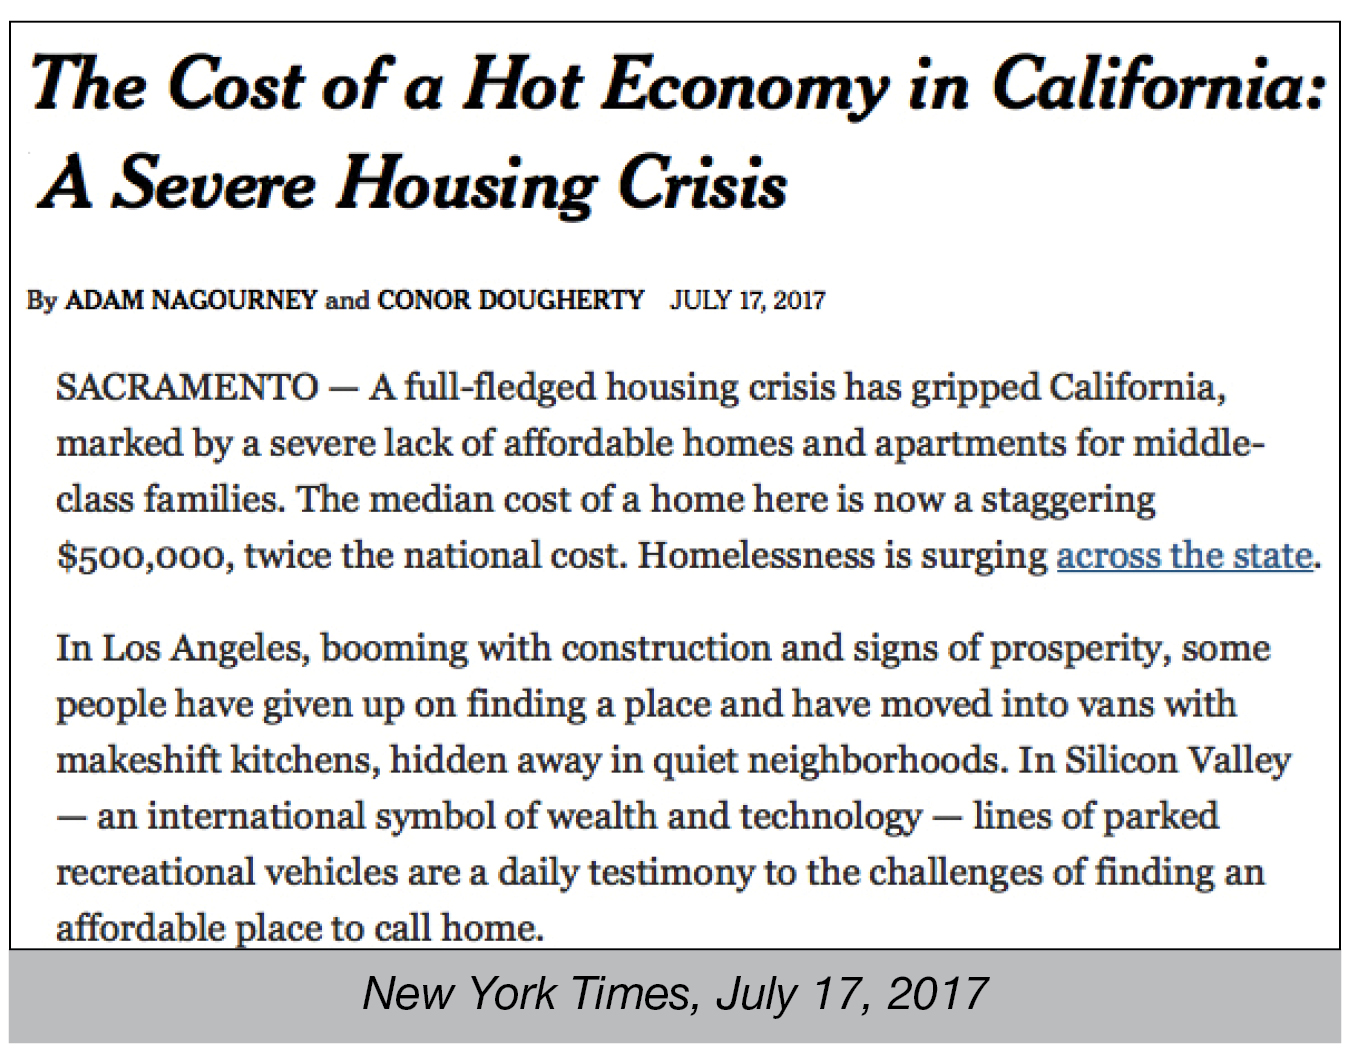
Home sales are weak nationwide. In California, new housing is not keeping pace with commercial and industrial development. Consequently, California has predictably ended up with less new housing and sharply higher housing values. Higher home values are currently indicative of most robust regional economies in the nation.

And though higher housing values are making homeowners happy, they are slowing down the new and existing home sales markets, along with marginally rising mortgage rates.

The housing slowdown in and of itself won’t likely derail the economy, but it represents another sector that would weigh negatively on GDP growth and jobs in finance and real estate.

The Wealth Effect

The decline in stock market valuation has evaporated billions of dollars in household wealth. And through the wealth effect, consumer spending is interrupted by declines in asset values that represent household wealth. This includes home prices and stock prices. Declining values could overwhelm the positives that are now powering consumer spending and much of the economy, so the stock market is a key indicator for economists to watch closely.

If stock prices fall further in 2019, consumer spending could be meaningfully impacted and the risk of recession will certainly rise.

Foreign Trade

The fiscal stimulus in 2018 enabled U.S. companies to shake off signs of slower growth in China, Japan, Germany and elsewhere.

That stimulus won’t have the same impact in 2019. So investors worry about future growth, 2019 corporate earnings and 2019 profitability.

China is the third largest importer of U.S. goods and services representing over eight percent of all U.S. exports. Slowing Chinese growth is a drag on world GDP growth meaning a drag on U.S. GDP growth as well, due to less production of goods and services going to China. Lower growth rates for other countries exporting to China further slows our exports to those countries. This represents another potential crack.

Oil prices are sliding despite cuts in production by Saudi Arabia, one of the largest producers in the world. Why? Because everyone else is maximizing their production. Softer oil prices are good for consumers and the airlines, but bad for oil companies who employ thousands of workers worldwide. Falling oil prices won’t derail the economy but would likely produce energy sector layoffs and volatility in energy stock values.

Interest Rates

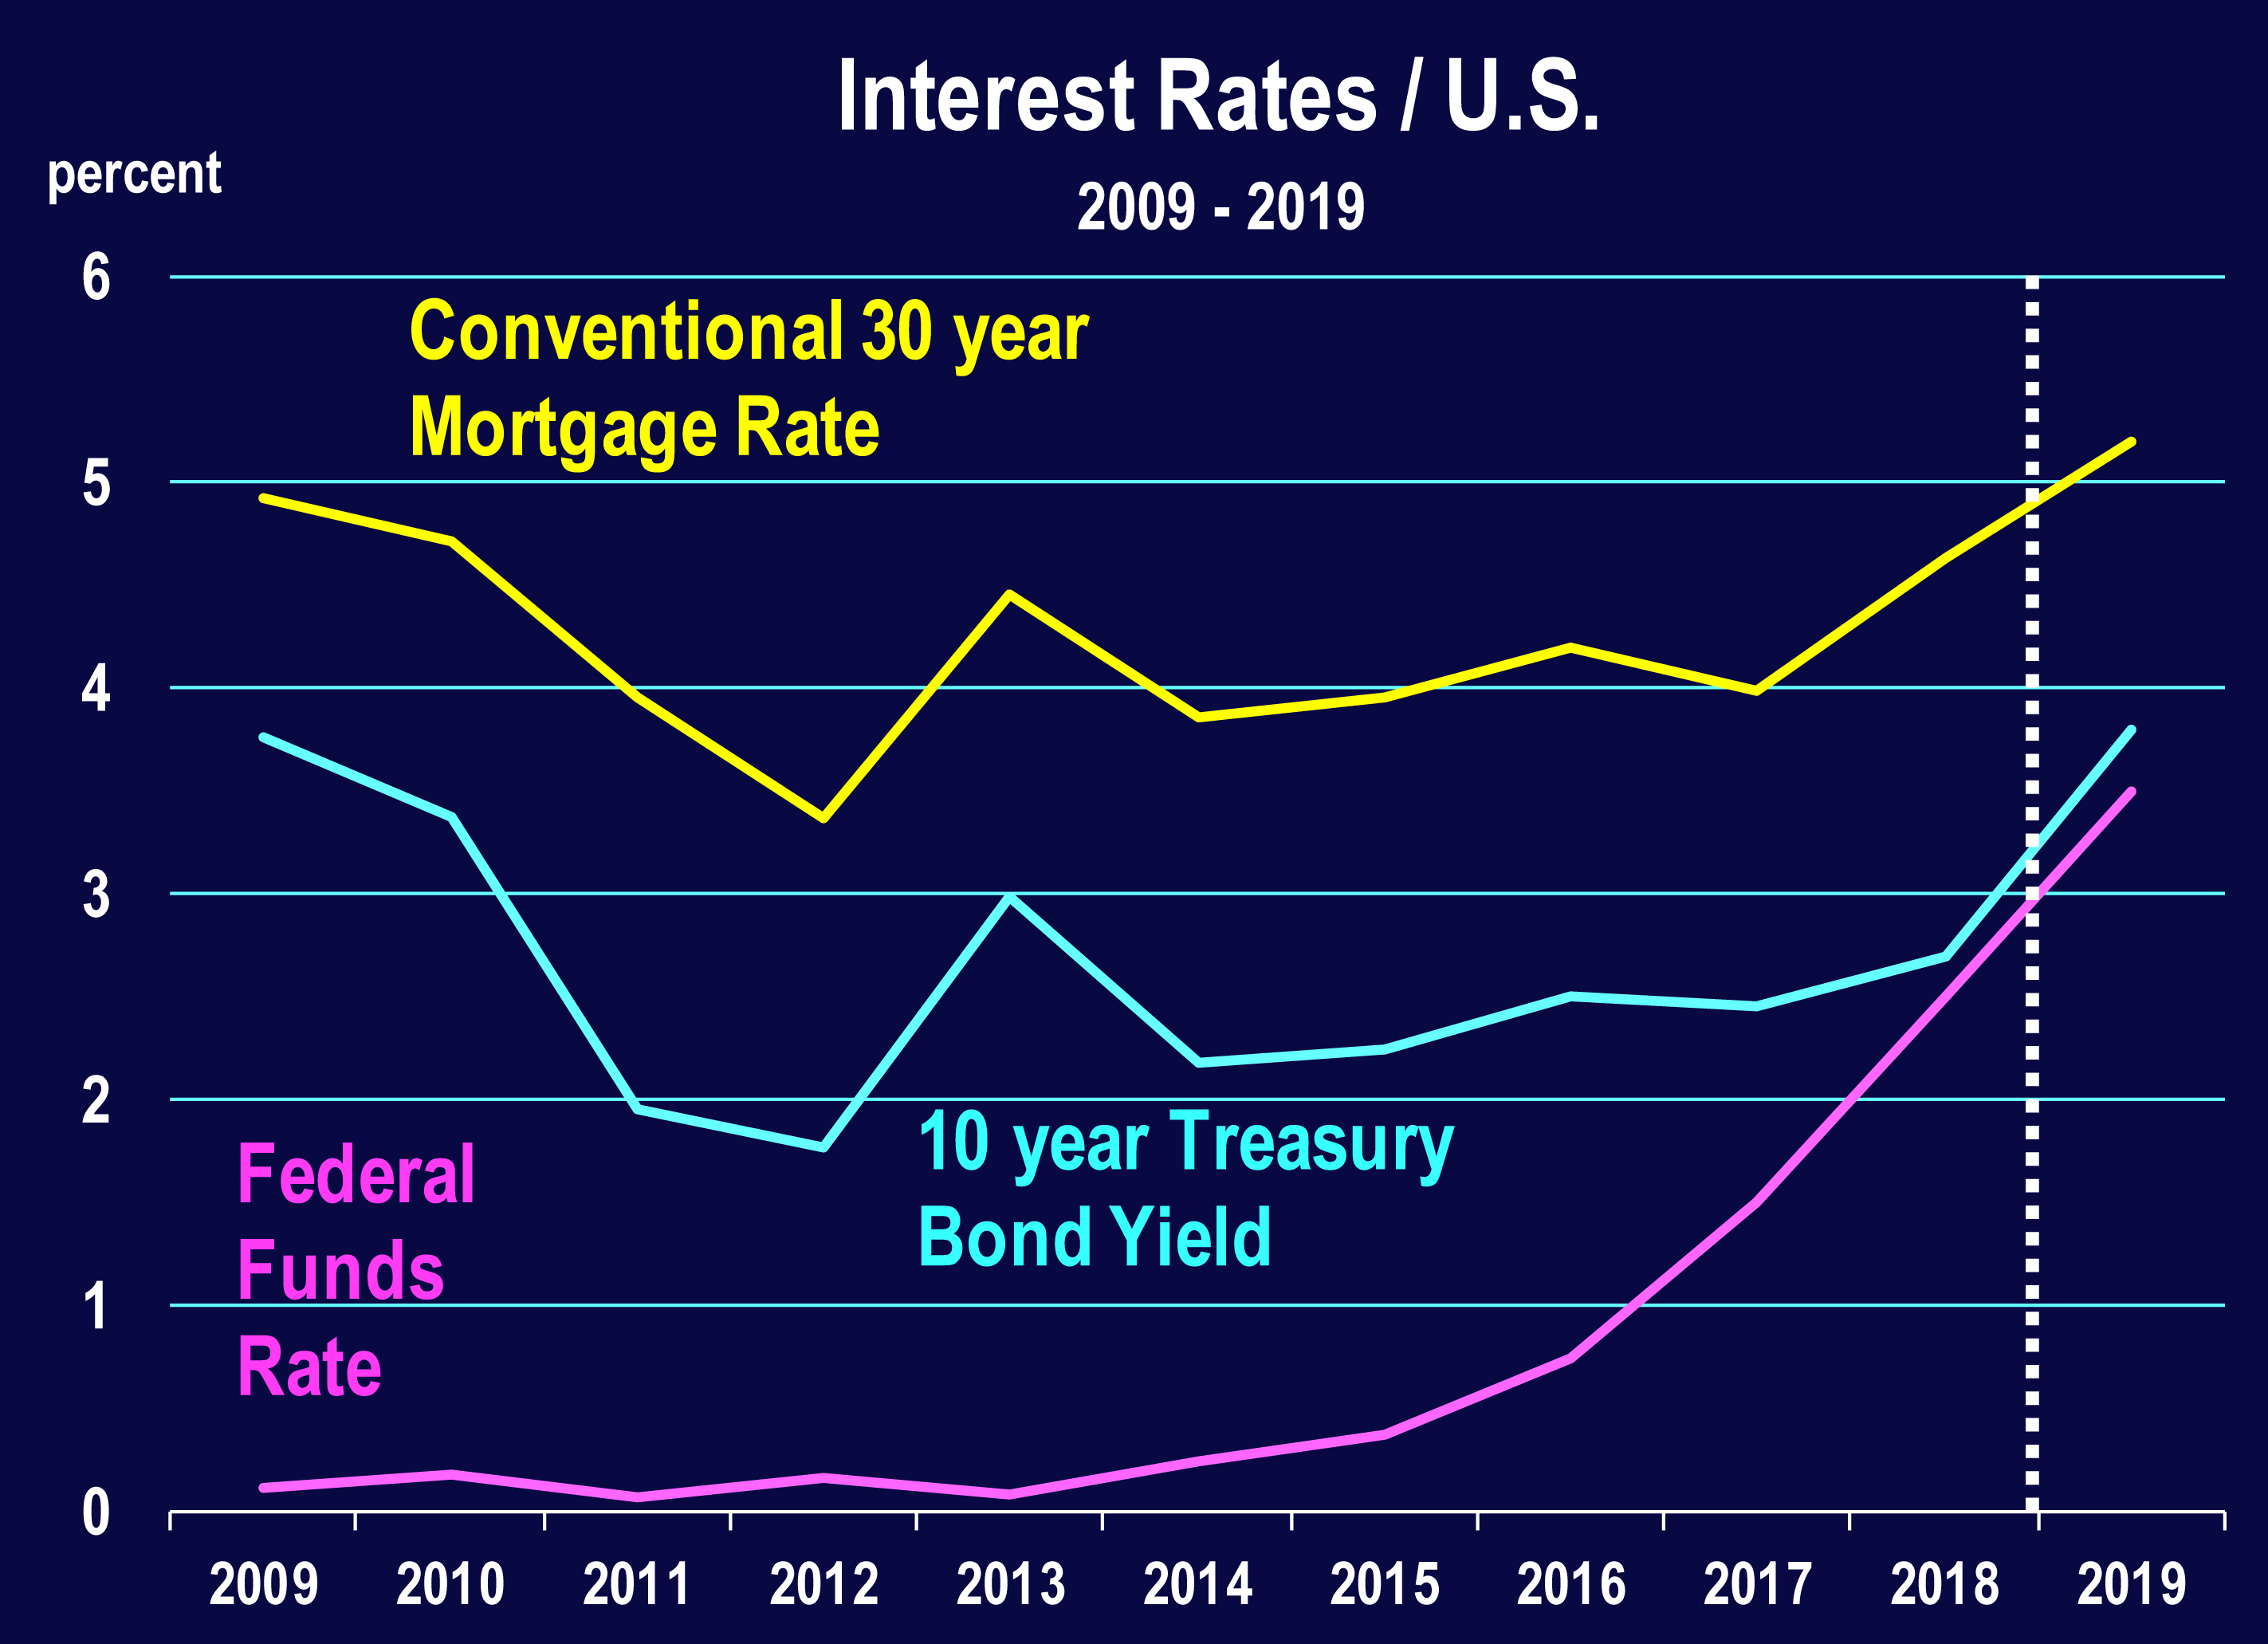
The Fed was poised to increase short term interest rates three more times in 2019, and perhaps a fourth time as well, pushing the federal funds rate to as high as 3.5 percent by the end of the year.

Higher rates reduce the demand for goods in interest rate sensitive sectors, such as housing and automobiles. They increase debt service levels and business credit costs in general, i.e., the cost of financing business operations and/or expansion plans.

But on January 30, the Fed issued a statement that surprisingly altered its course from one of normalizing interest rates to one of “patience” with interest rates as it evaluates the economy in 2019.

Economist Mark Zandi of economy.com predicted: “ . . . If the stock market fails to rally from here, it is possible there would be no [further] rate hikes in 2019. And, if stock prices fall measurably further, the slowing in growth could even force the Fed to ease monetary policy by the end of the year.”[1]

Even Fed chair Jerome Powell said himself, “The case for raising rates has decreased somewhat.”

A more dovish monetary policy stance along with inflation being a non-issue has led investors to buy both stocks and long term bonds, rallying the stock market over the last month and depressing longer term interest rate yields again.

Consequently, as of now, it does not appear that interest rates will lead to the possibility of a weaker economy in 2019.

Finally: Credit Spreads

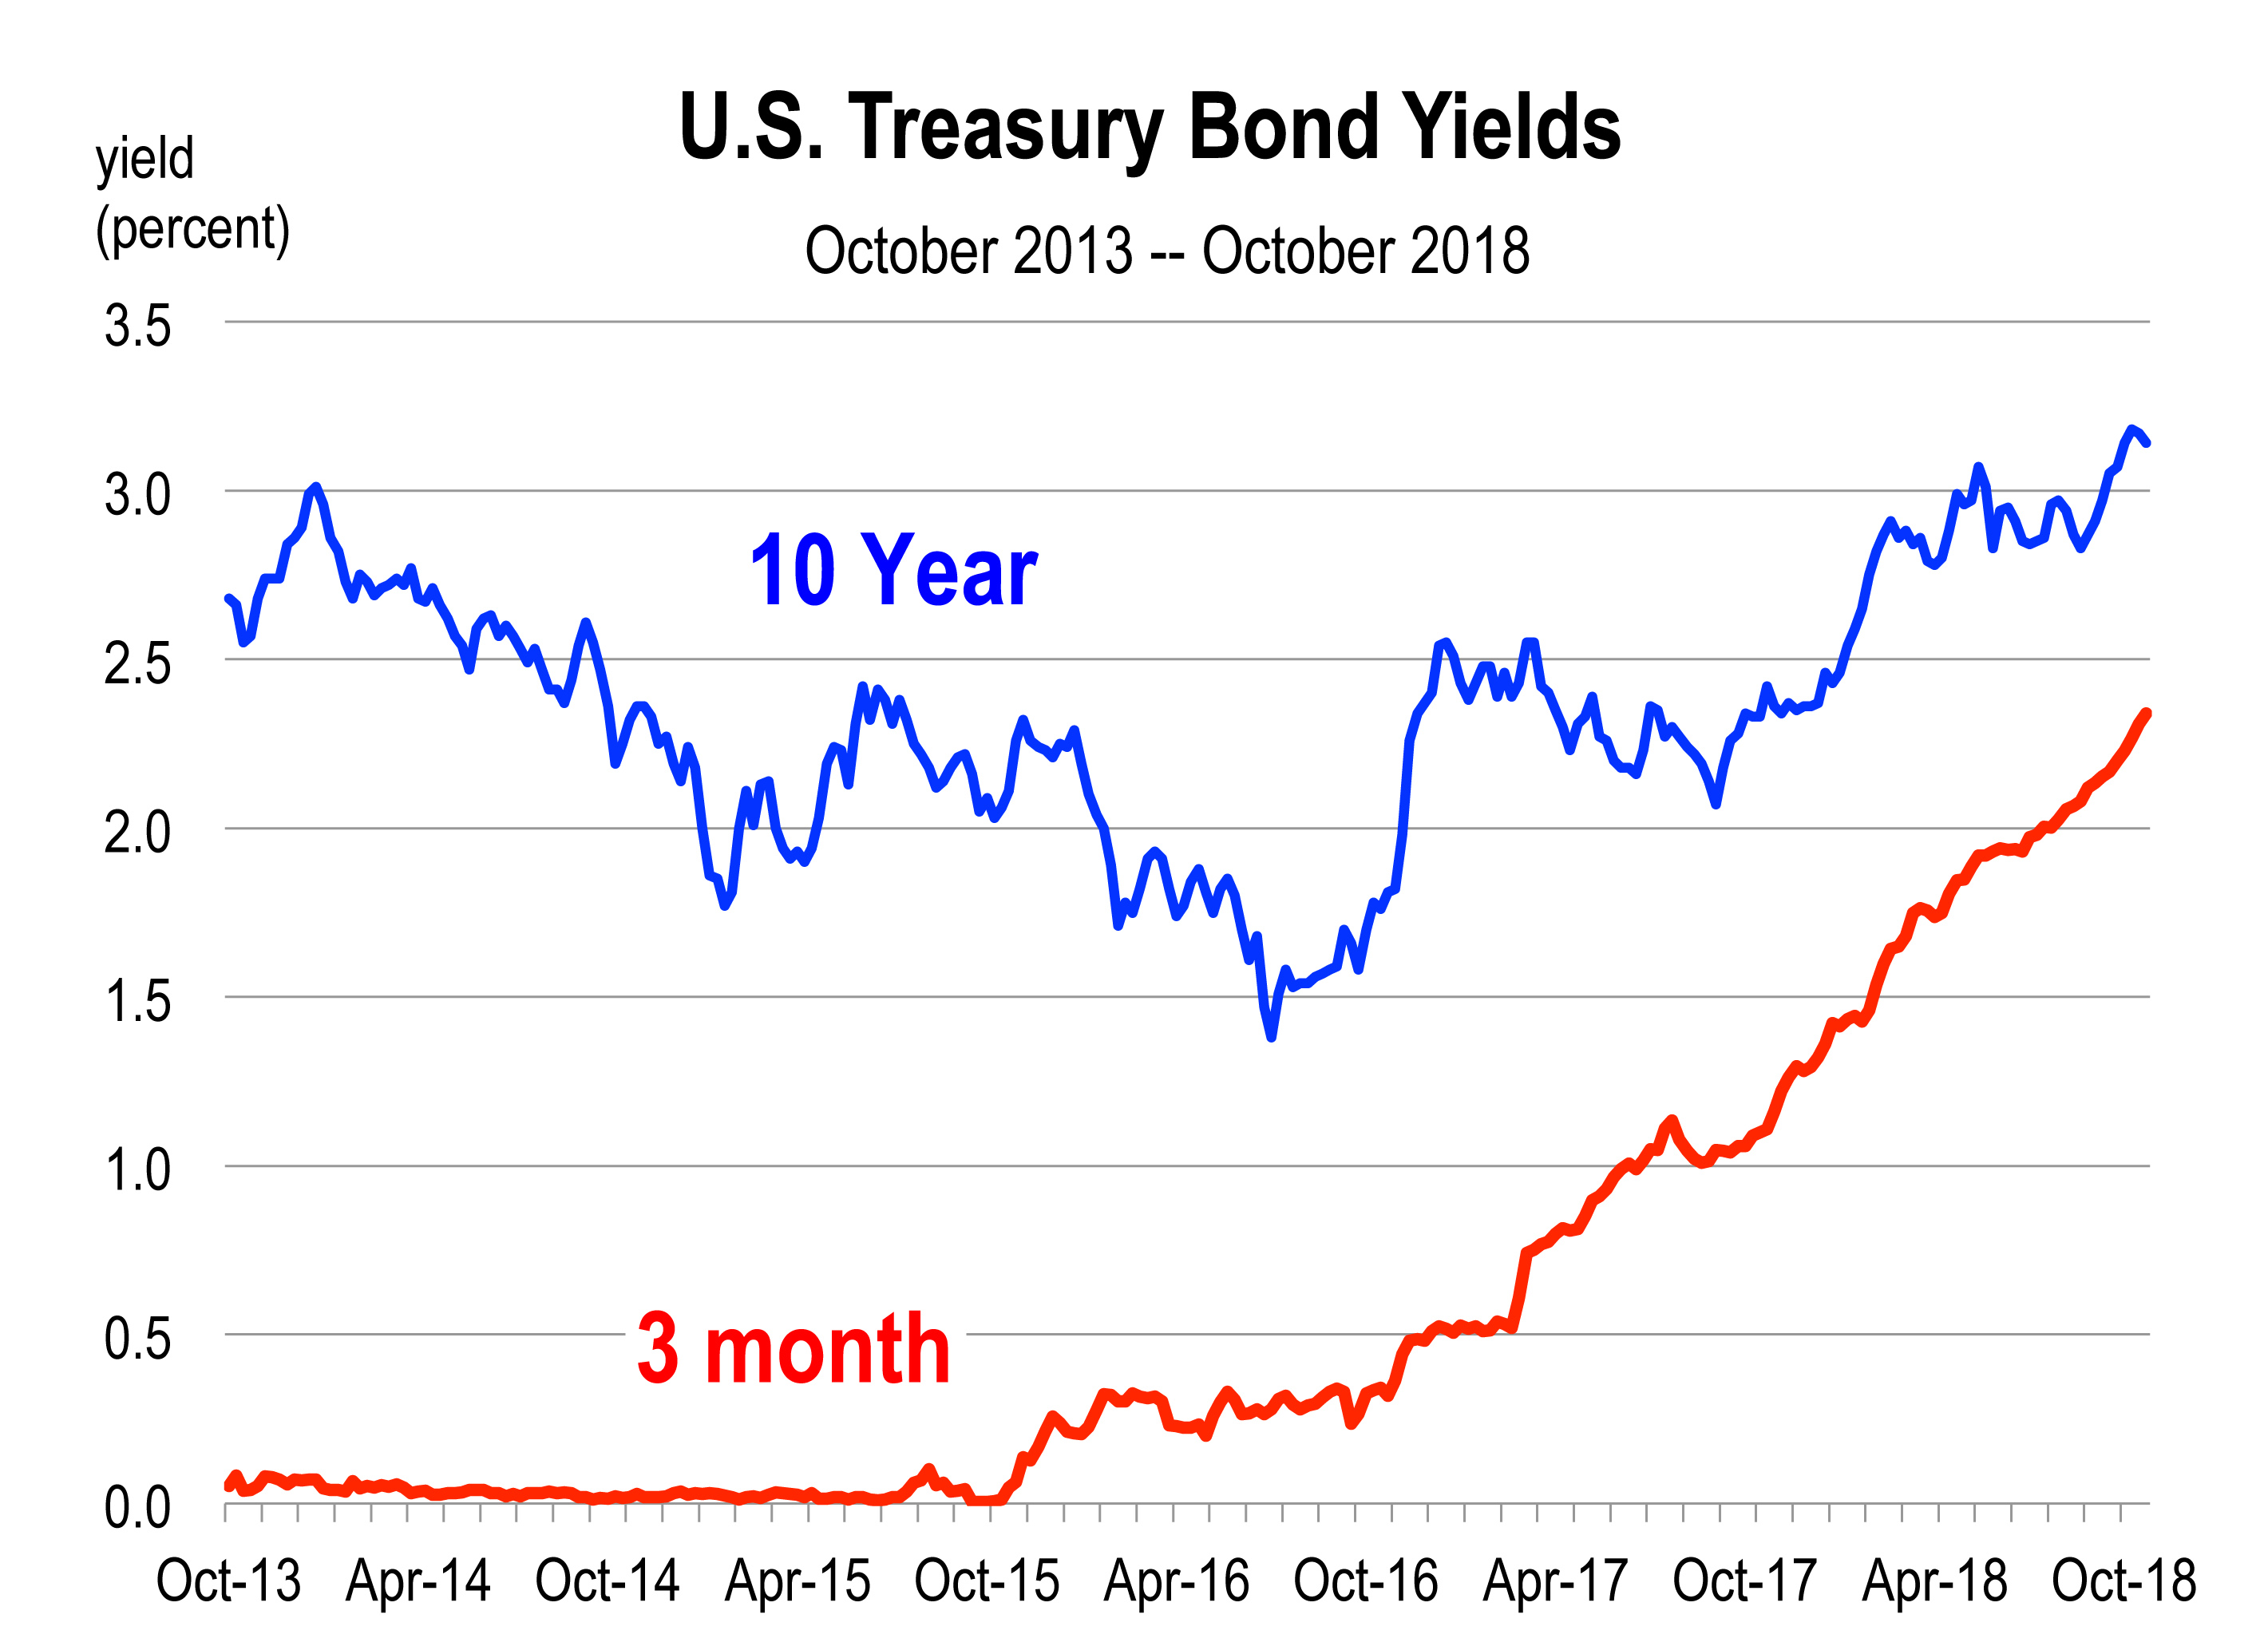
Bond investors are now demanding high yields for the higher risk they perceive on government treasury bills or are selling short term paper to buy longer term notes.

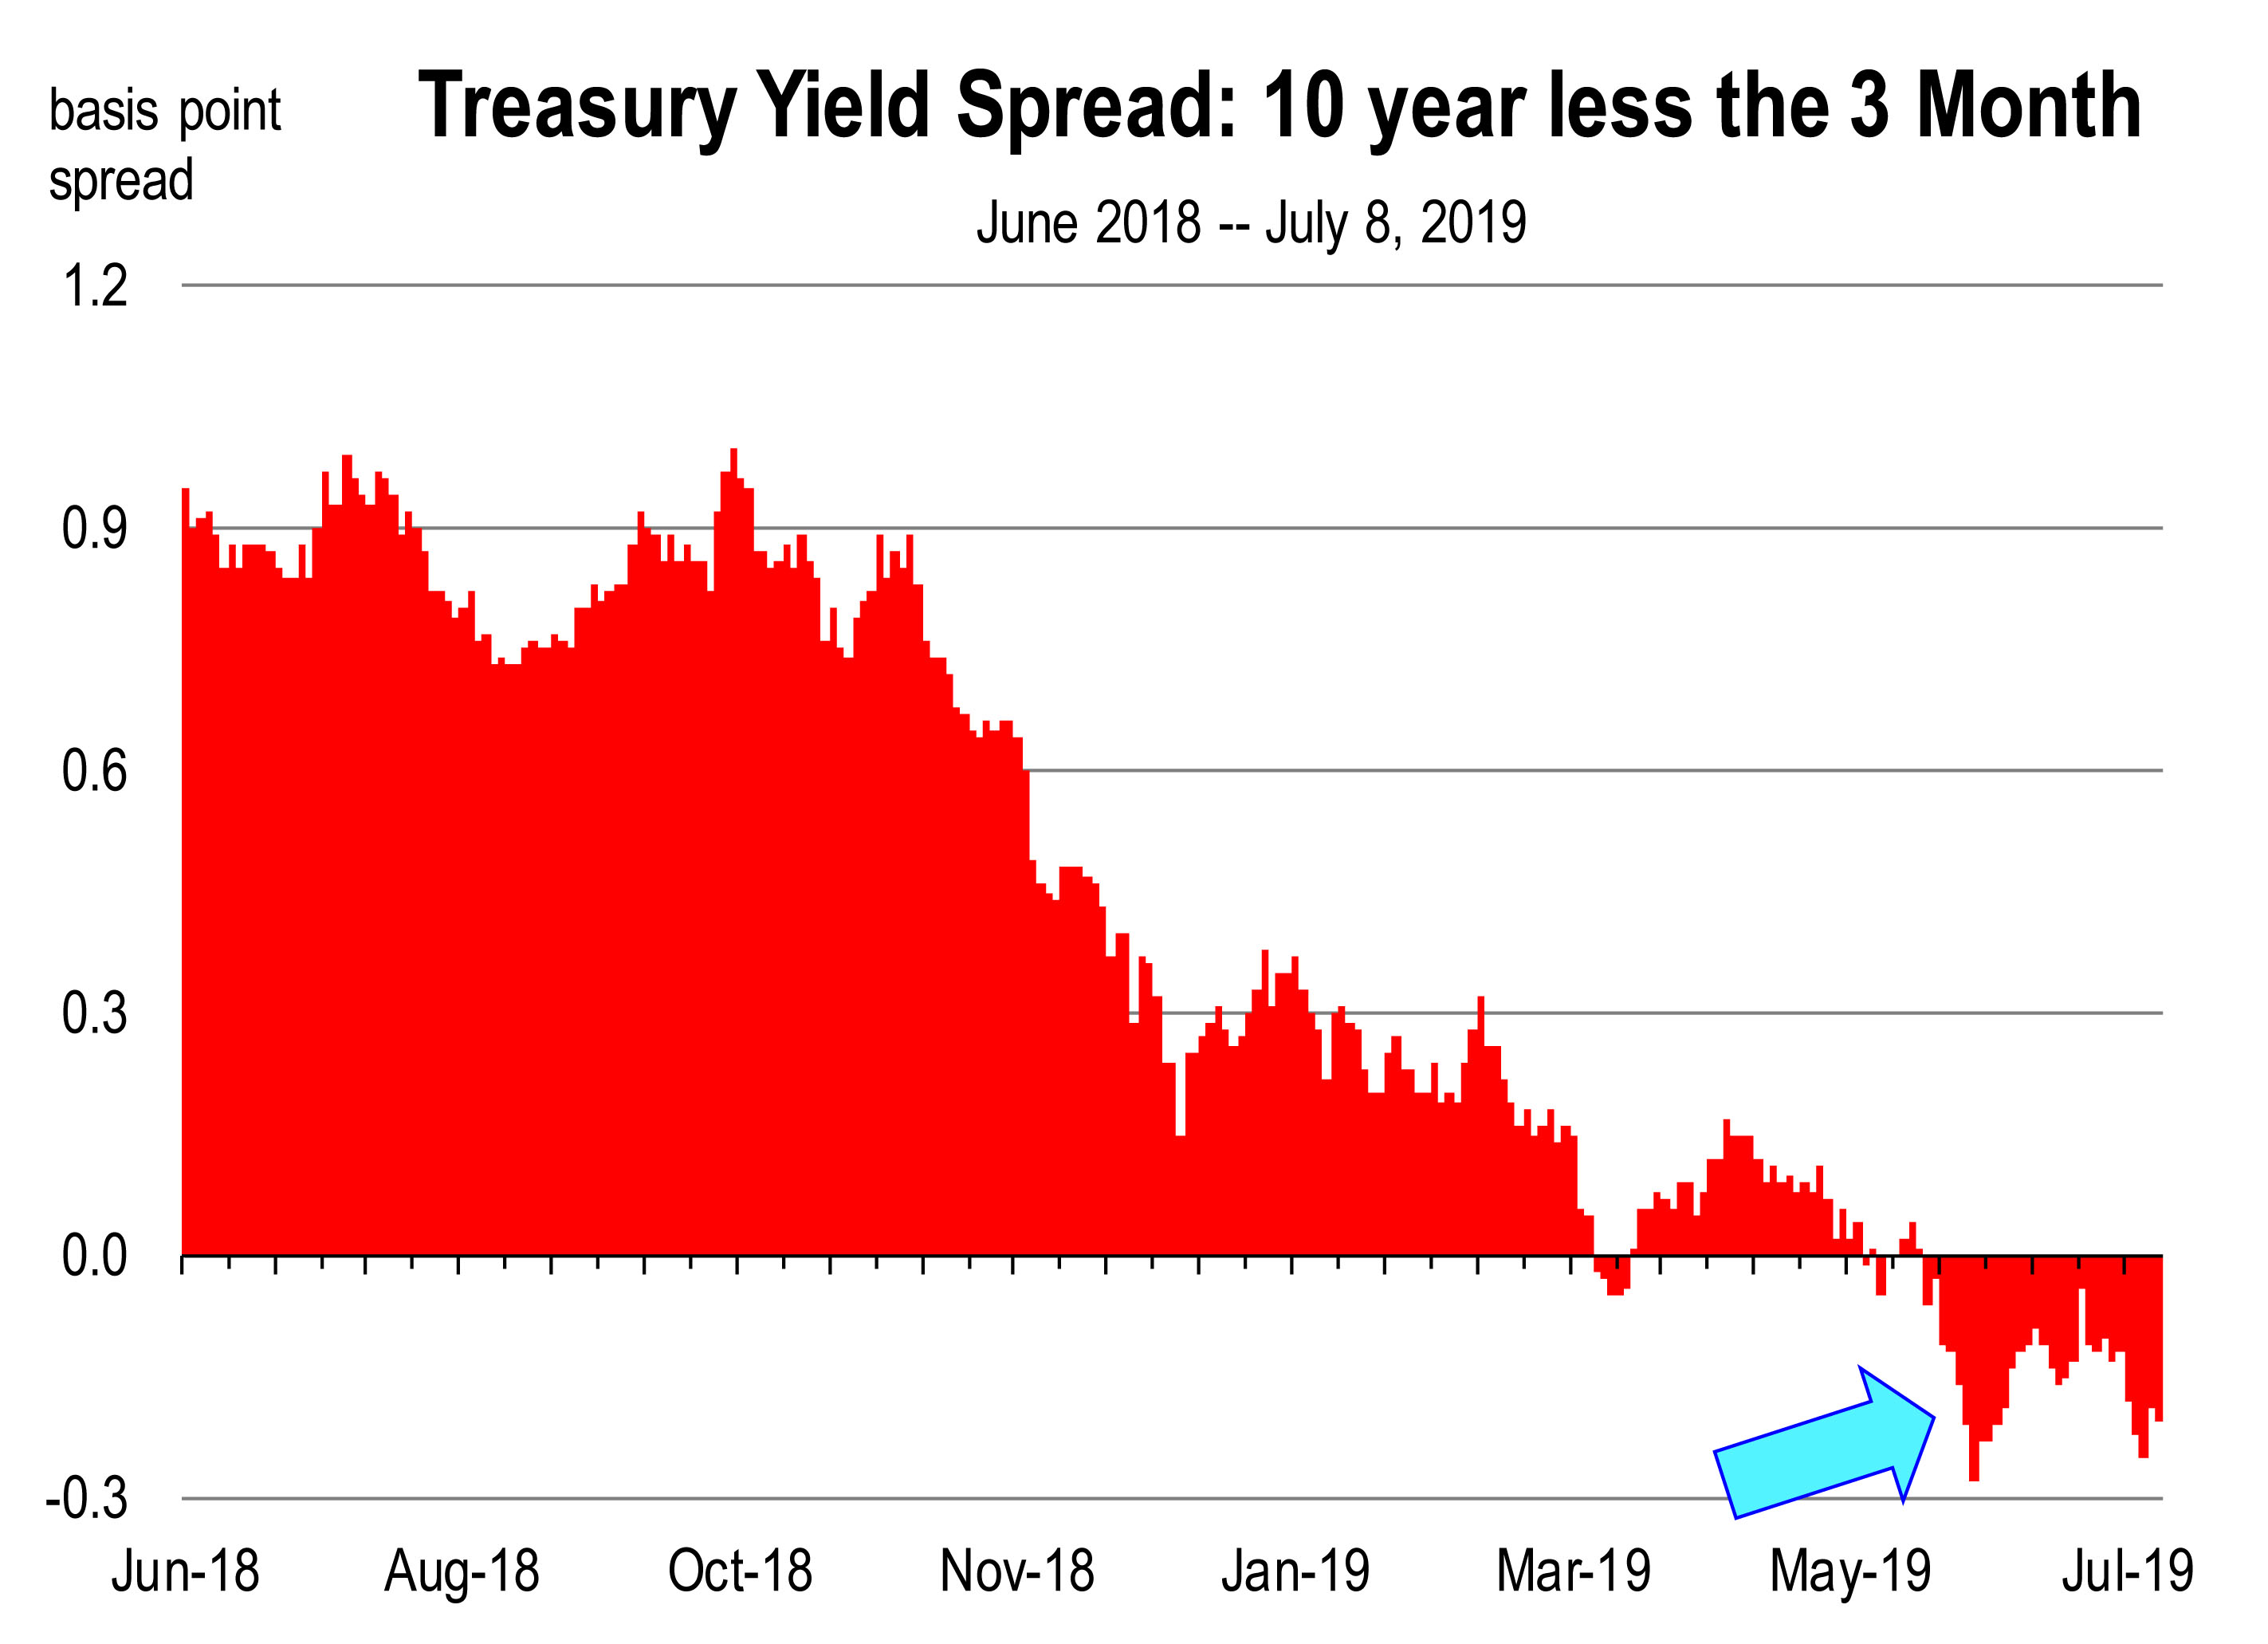
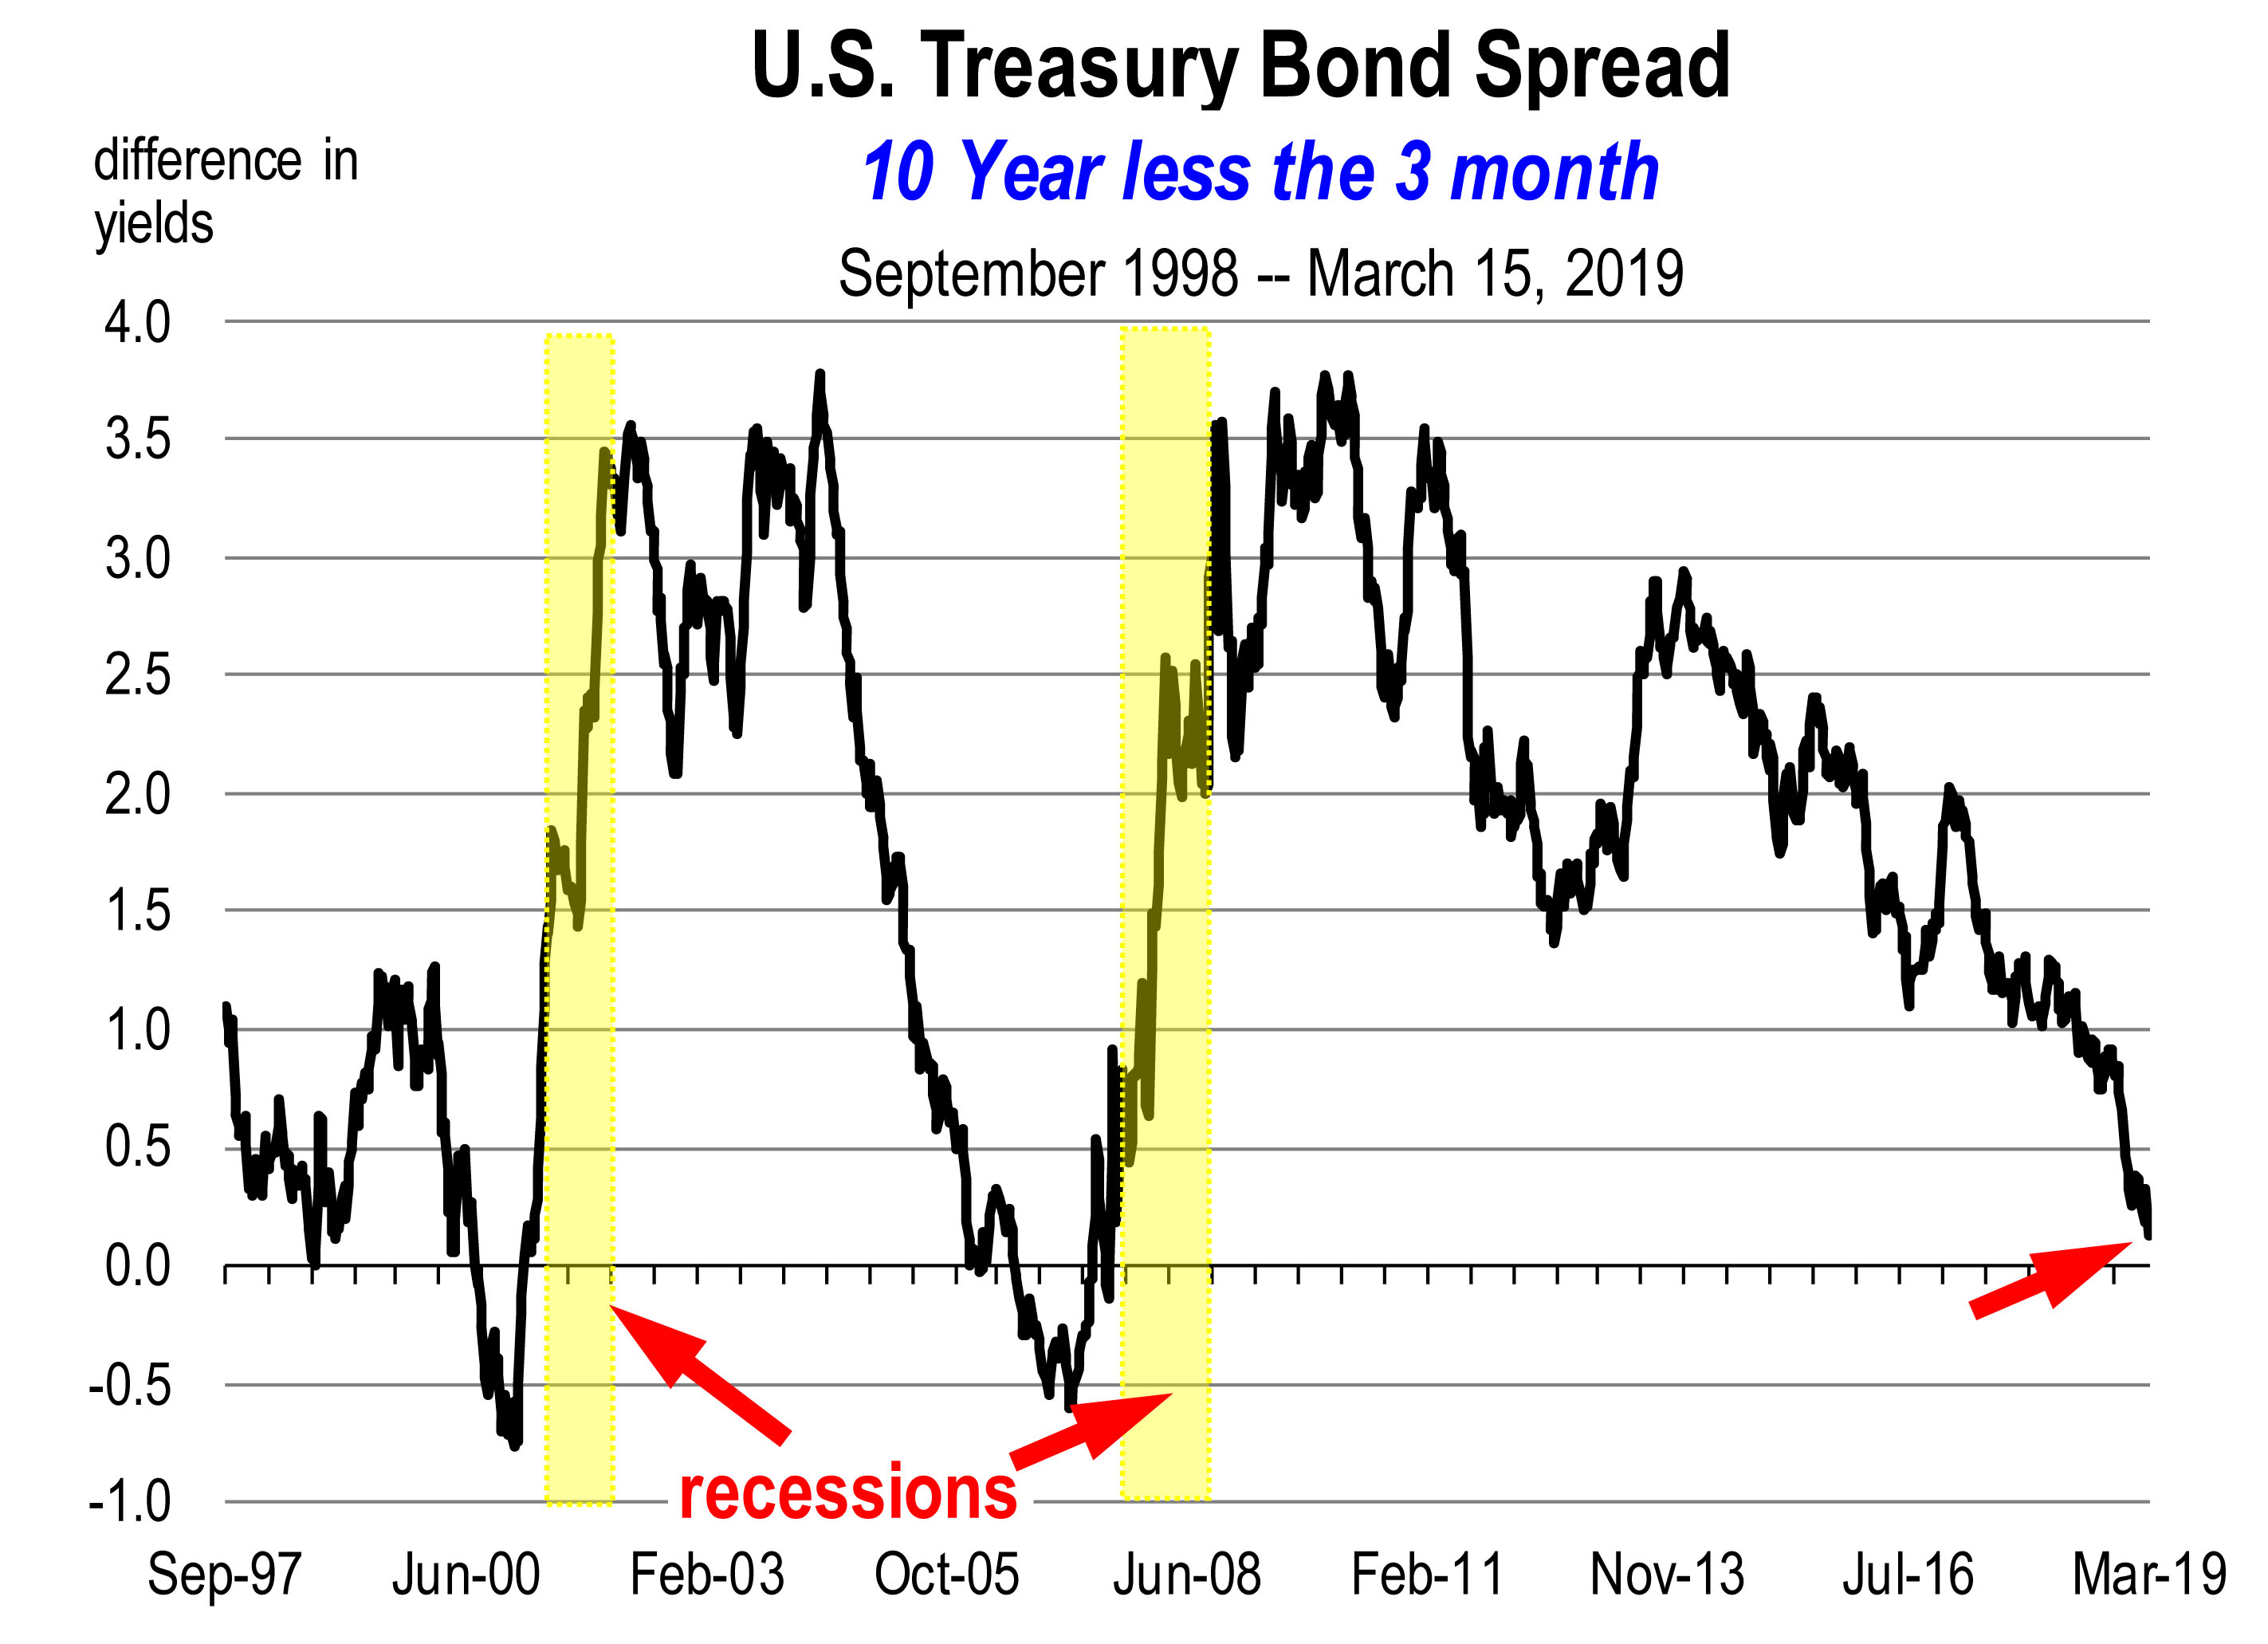
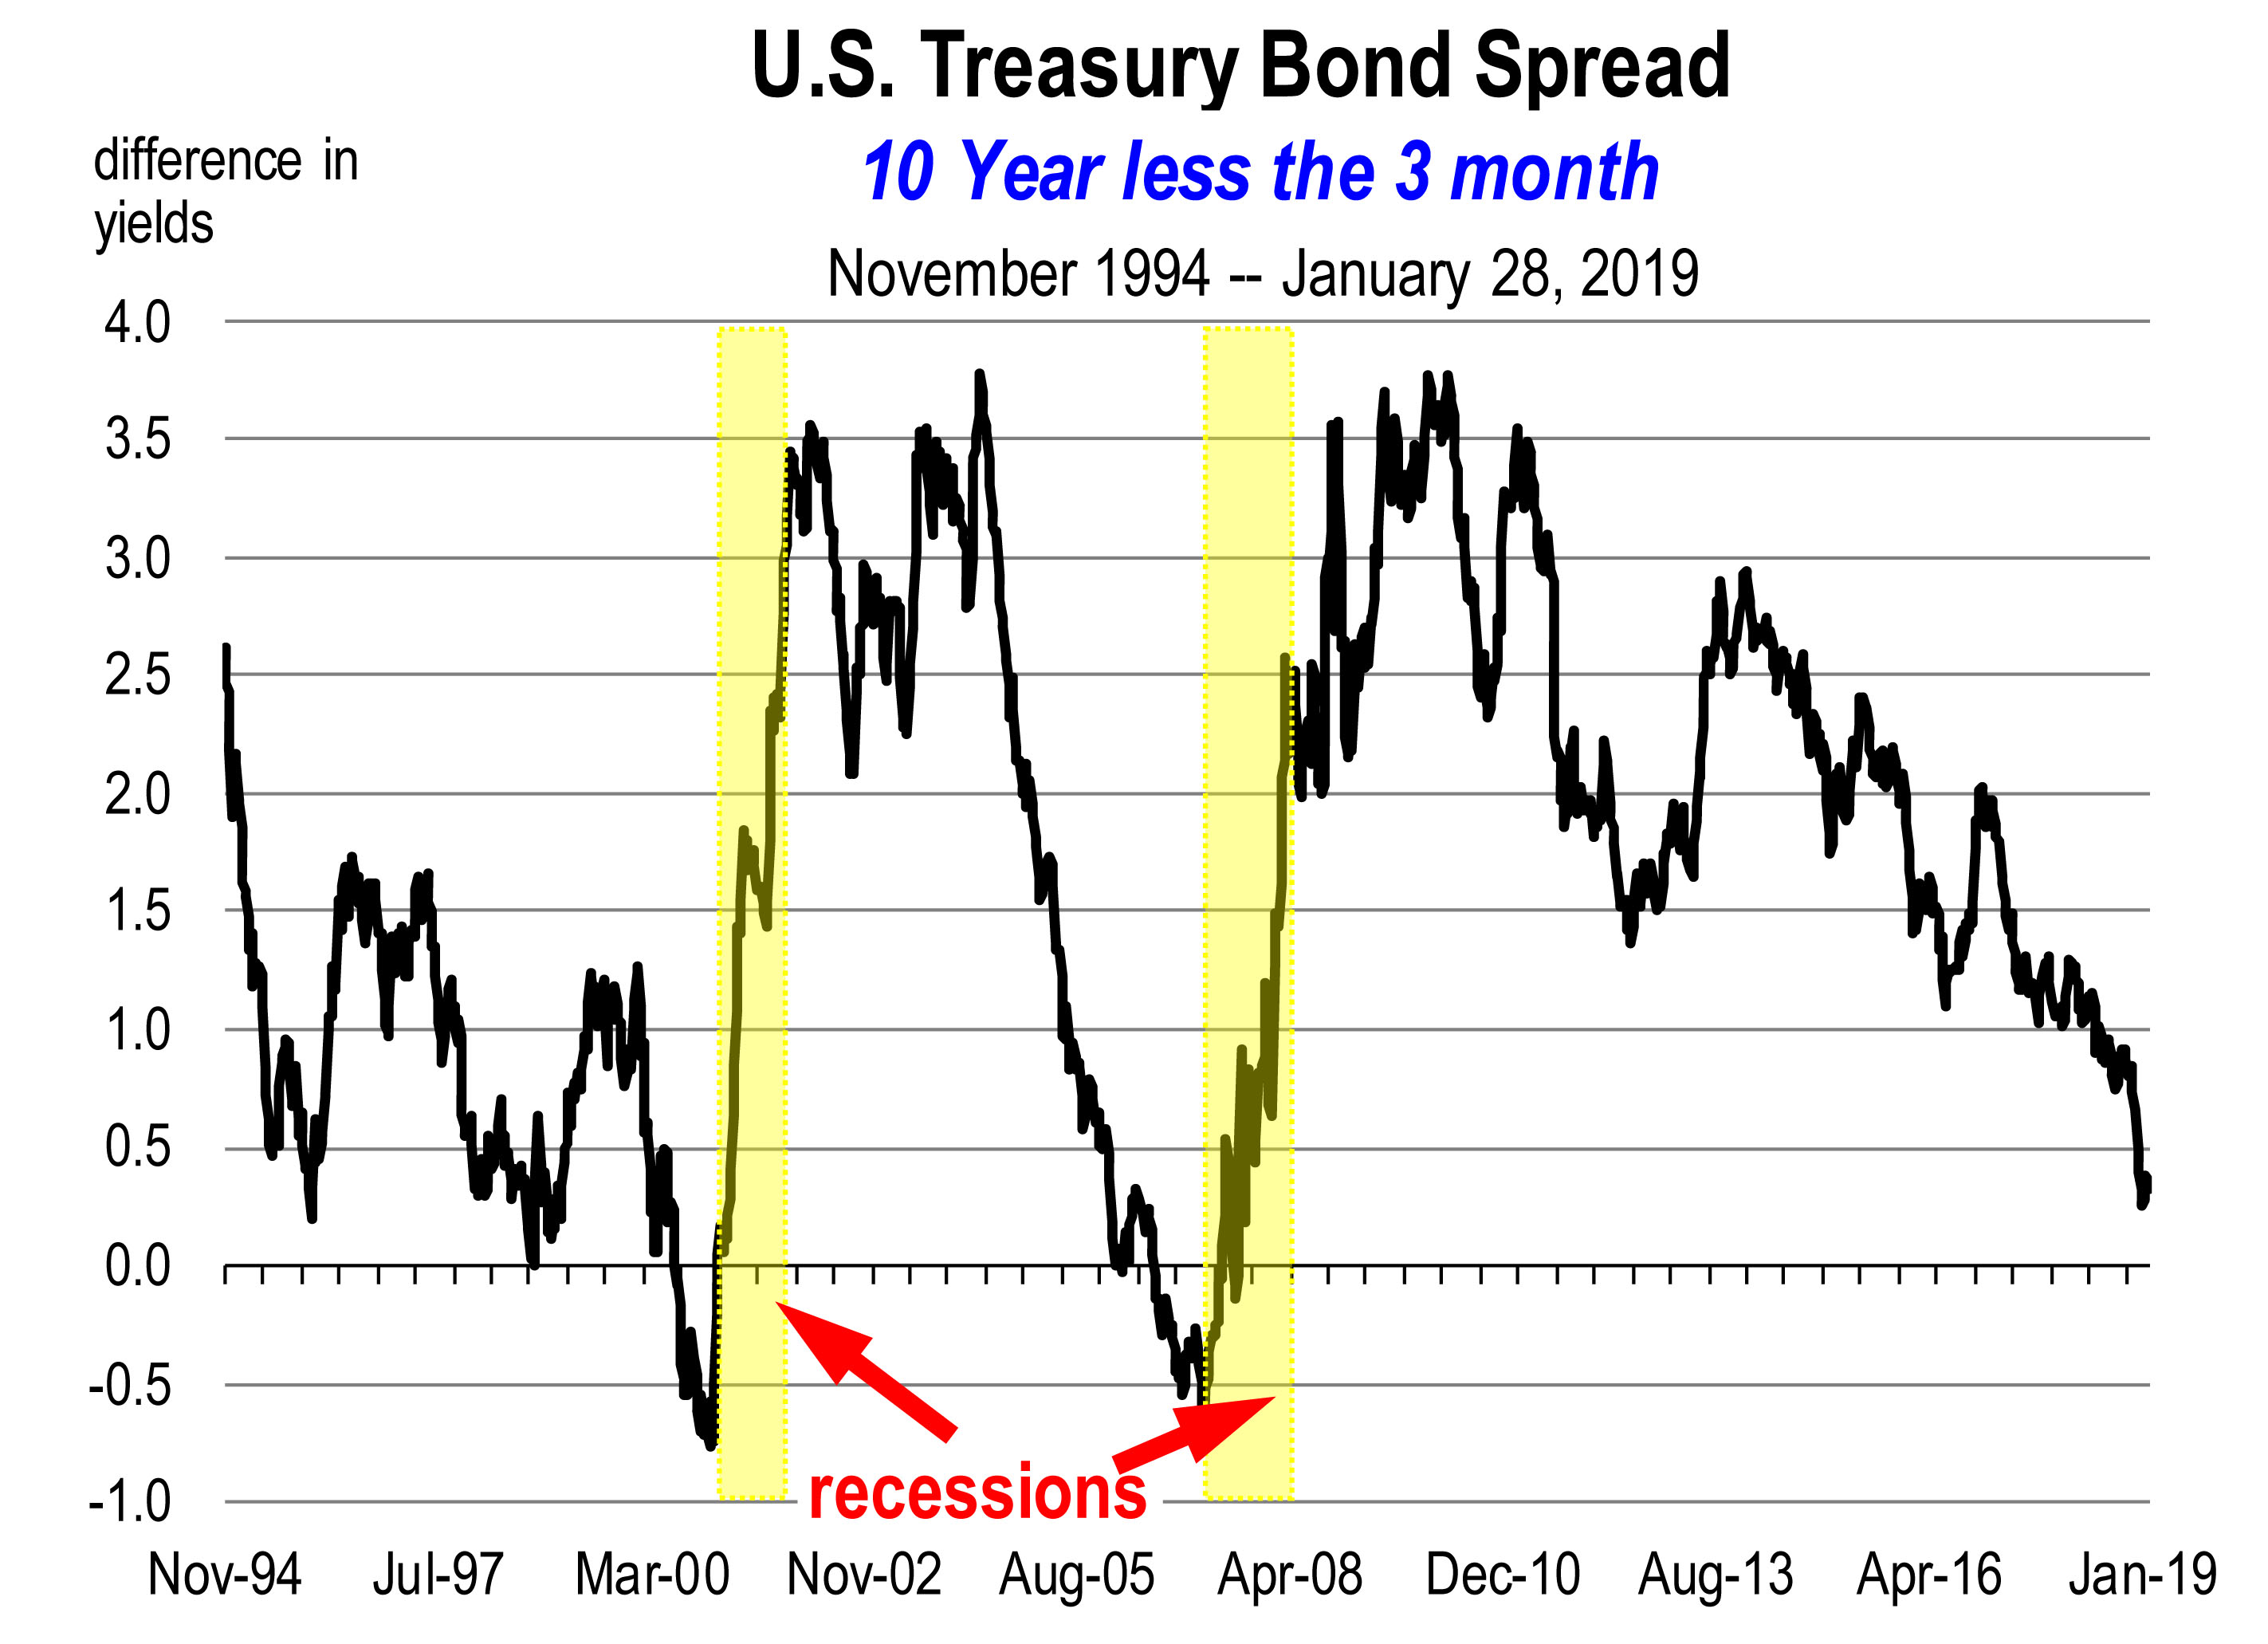
The yield curve, as measured by the spread between short-dated yields and longer term bond yields, has steadily flattened towards “an inversion.”

An inverted yield curve has a pretty reliable reputation as a precursor to recession, Right now, the spread between the two is 27 basis points, the narrowest spread since August 2007.

This is a signal we can’t ignore because it’s been correct in predicting the last seven recessions.[2]

Even when it turns negative, the yield spread doesn’t signal immediate doom. Over the past 60 years, inversions have occurred anywhere from five to 17 months before the downturn in GDP growth. The average time period is 11 months.

Now, no one can predict a recession based on the inversion of the spread. Just predicting when the spread goes negative is a presumptive endeavor. But I’ve never been accused of avoiding presumptive behavior so here’s my guess:

At the current pace of a narrowing spread, it would turn negative as early as this summer and as late as March 2020. That would imply a recession as early as the second quarter of 2020 and as late as the first quarter of 2021. What would cause a recession sometime between mid 2020 and early 2021? We don’t know yet.

———-
[1] Mark Zandi, “2019 U.S. Outlook: From Virtuous to Vicious Cycle,”, Moody’s Economy.com commentary, January 2, 2019

[2] https://www.washingtonpost.com/news/wonk/wp/2018/06/28/people-are-worried-about-these-economic-warning-signs-they-can-relax-for-now/?utm_term=.9c2c8e718a46

The California Economic Forecast is an economic consulting firm that produces commentary and analysis on the U.S. and California economies. The firm specializes in economic forecasts and economic impact studies, and is available to make timely, compelling, informative and entertaining economic presentations to large or small groups.

What To Expect in 2019

by Mark Schniepp
January 2019

Growth Was Strong in 2018

Nothing much fazed the economy in 2018. The wild oscillations in the stock market, the trade war with China, the California fires, or the midterm elections. The economy remained strong all year long.

The fiscal stimulus in the form of tax cuts played out as the principal factor for the solid economy in 2018.

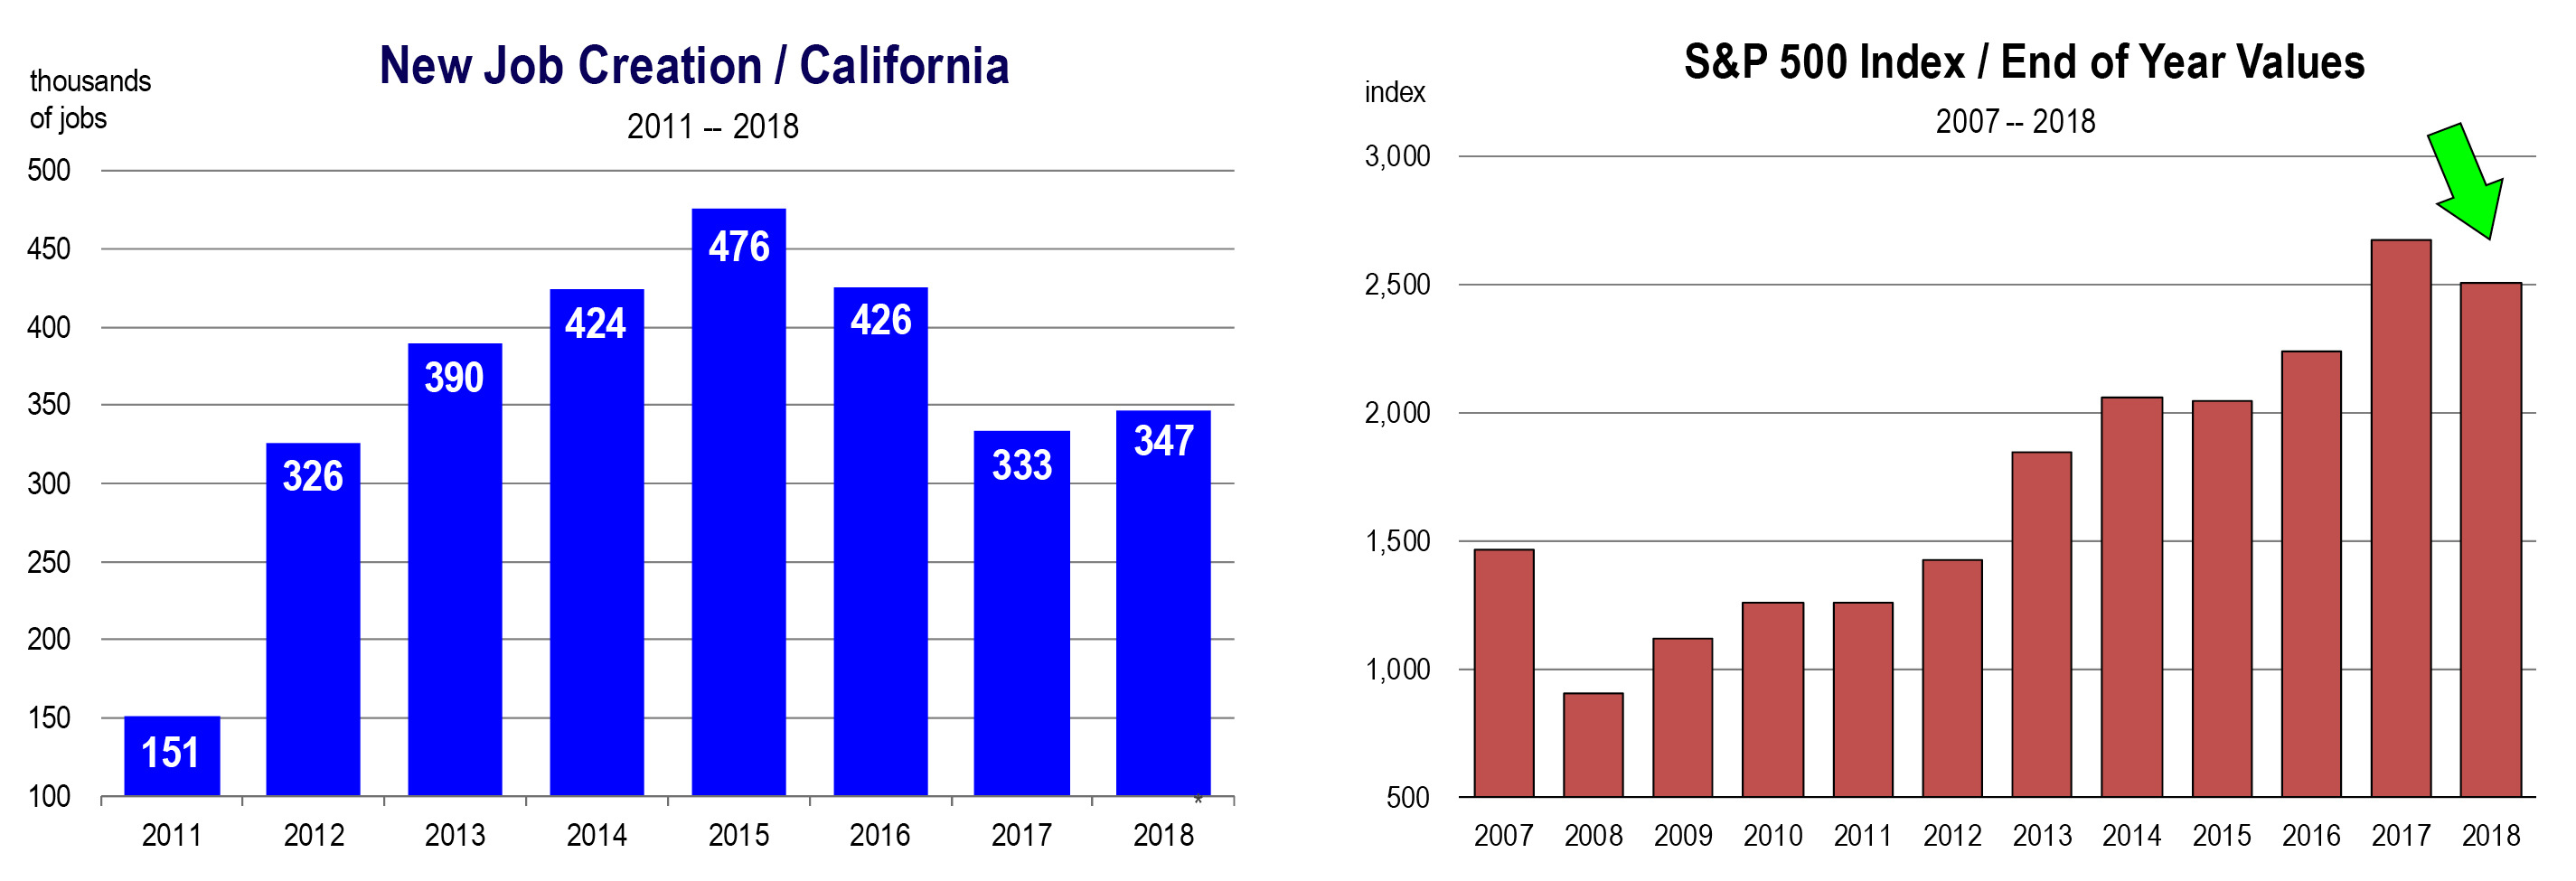
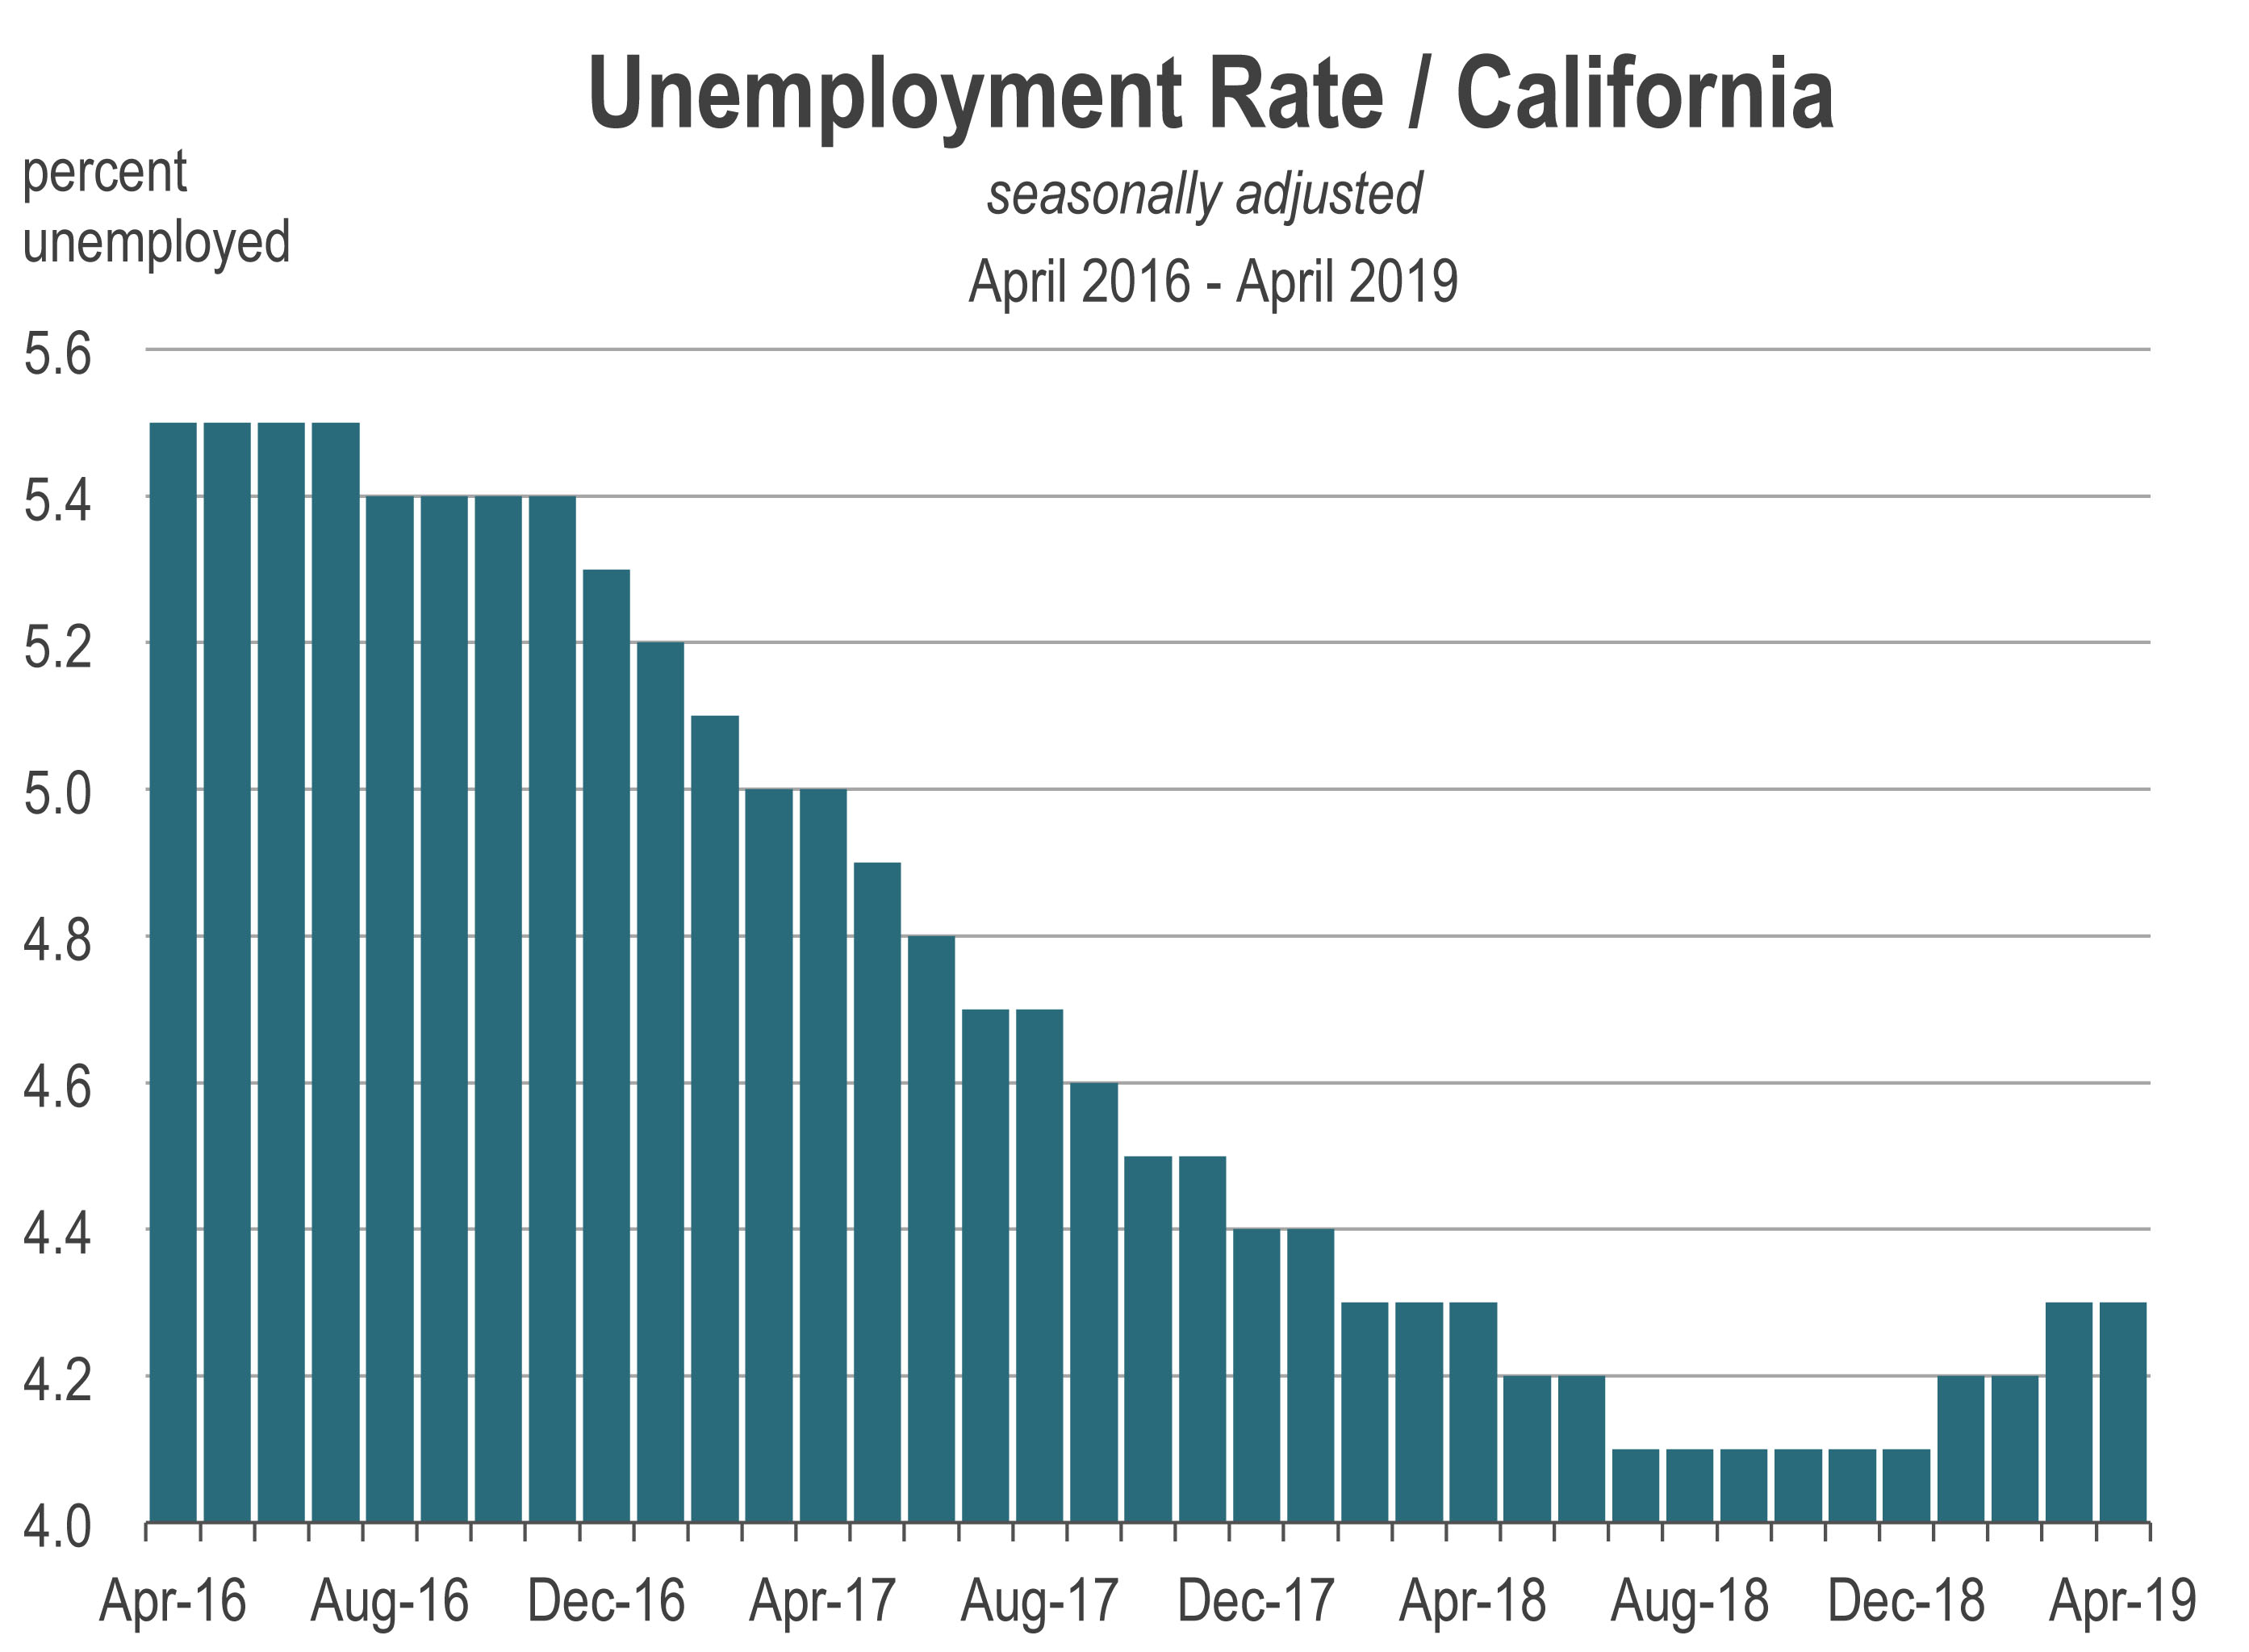
The California economy created 347,000 jobs last year, and the unemployment rate fell to the lowest level in 40 years.

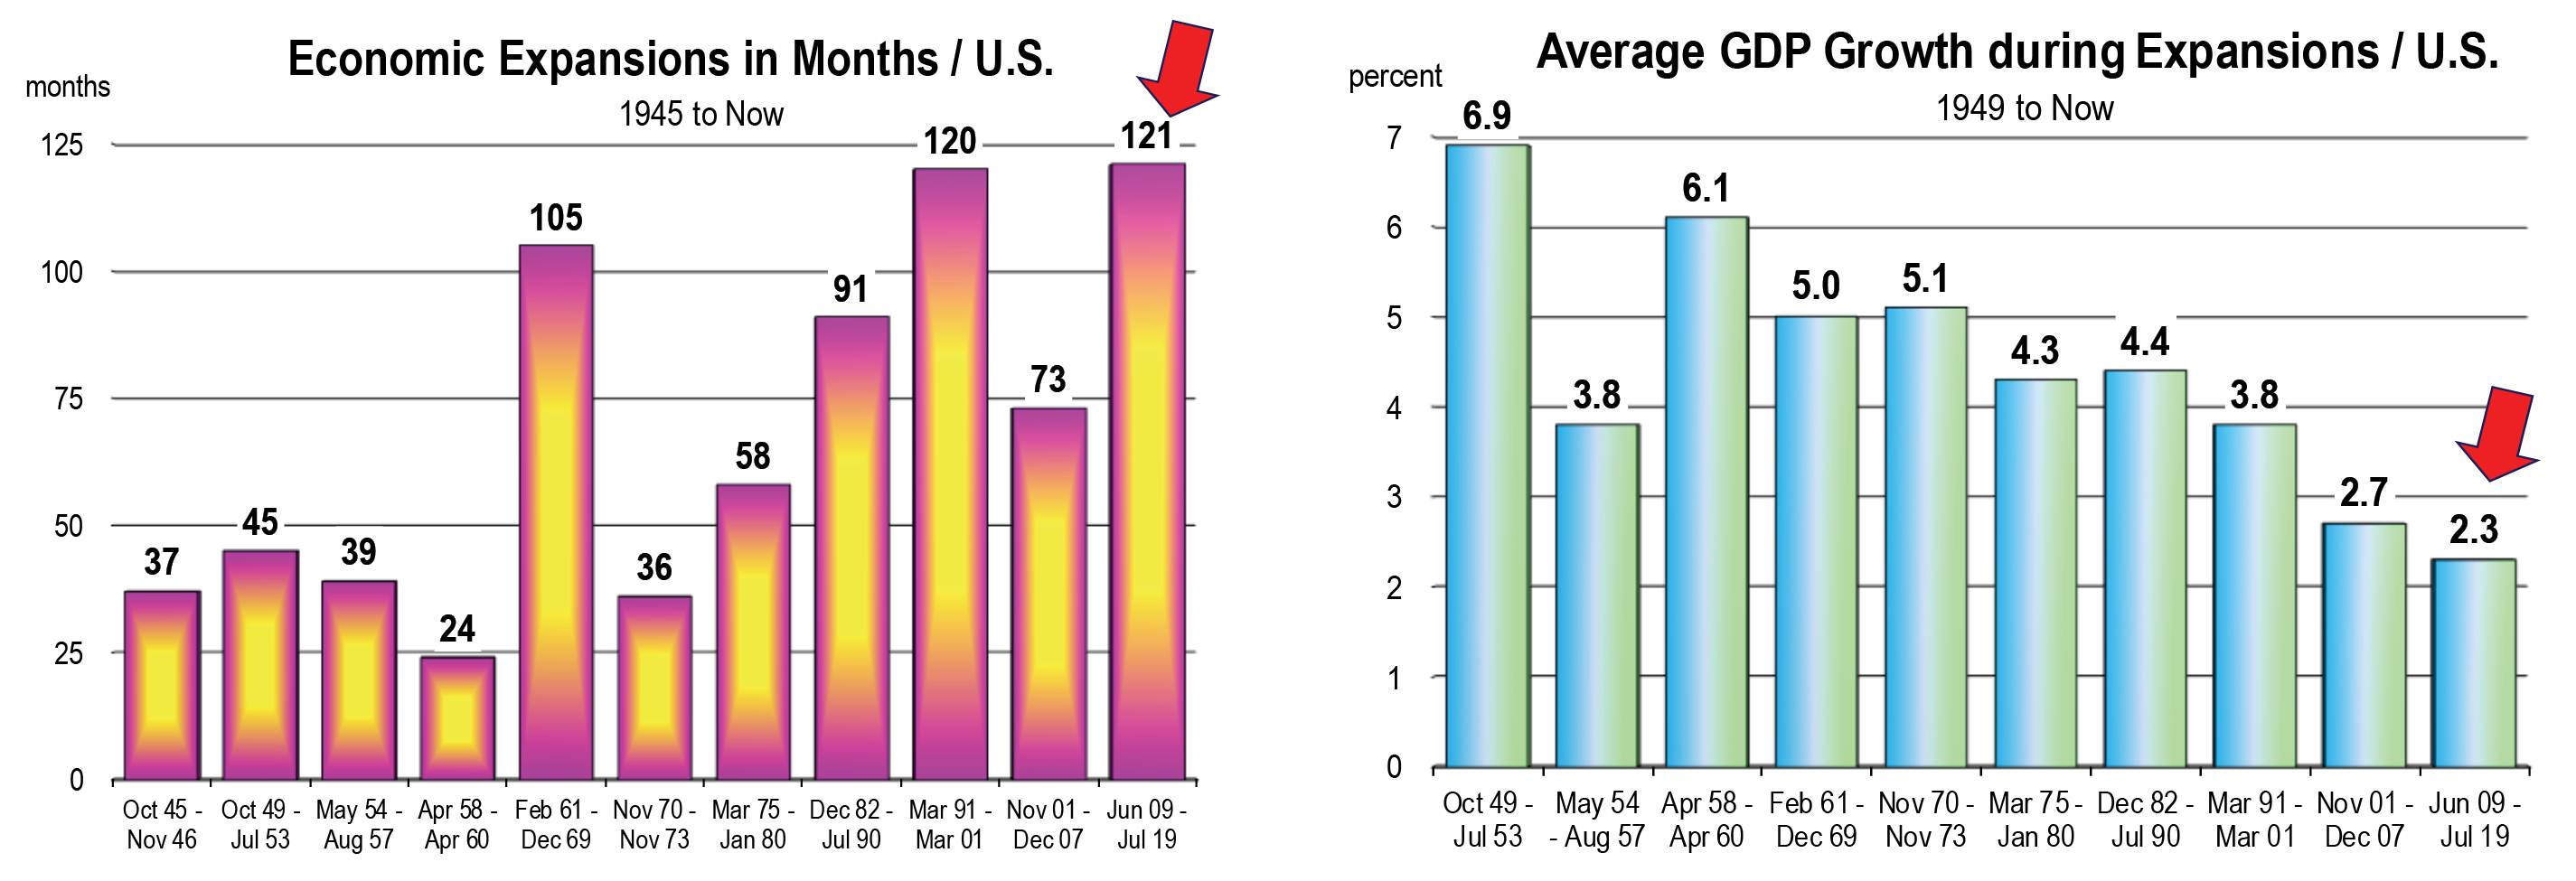
We are now in month 114 of the economic expansion and bearing down on the previous record of 120 expanding months from March 1991 to March 2001. I have little doubt that the current expansion will soon be the longest on record.

The S&P closed down 6.2 percent for the year. But because everybody is working and incomes are rising, consumer confidence remained high despite a roller coaster stock market.

2019

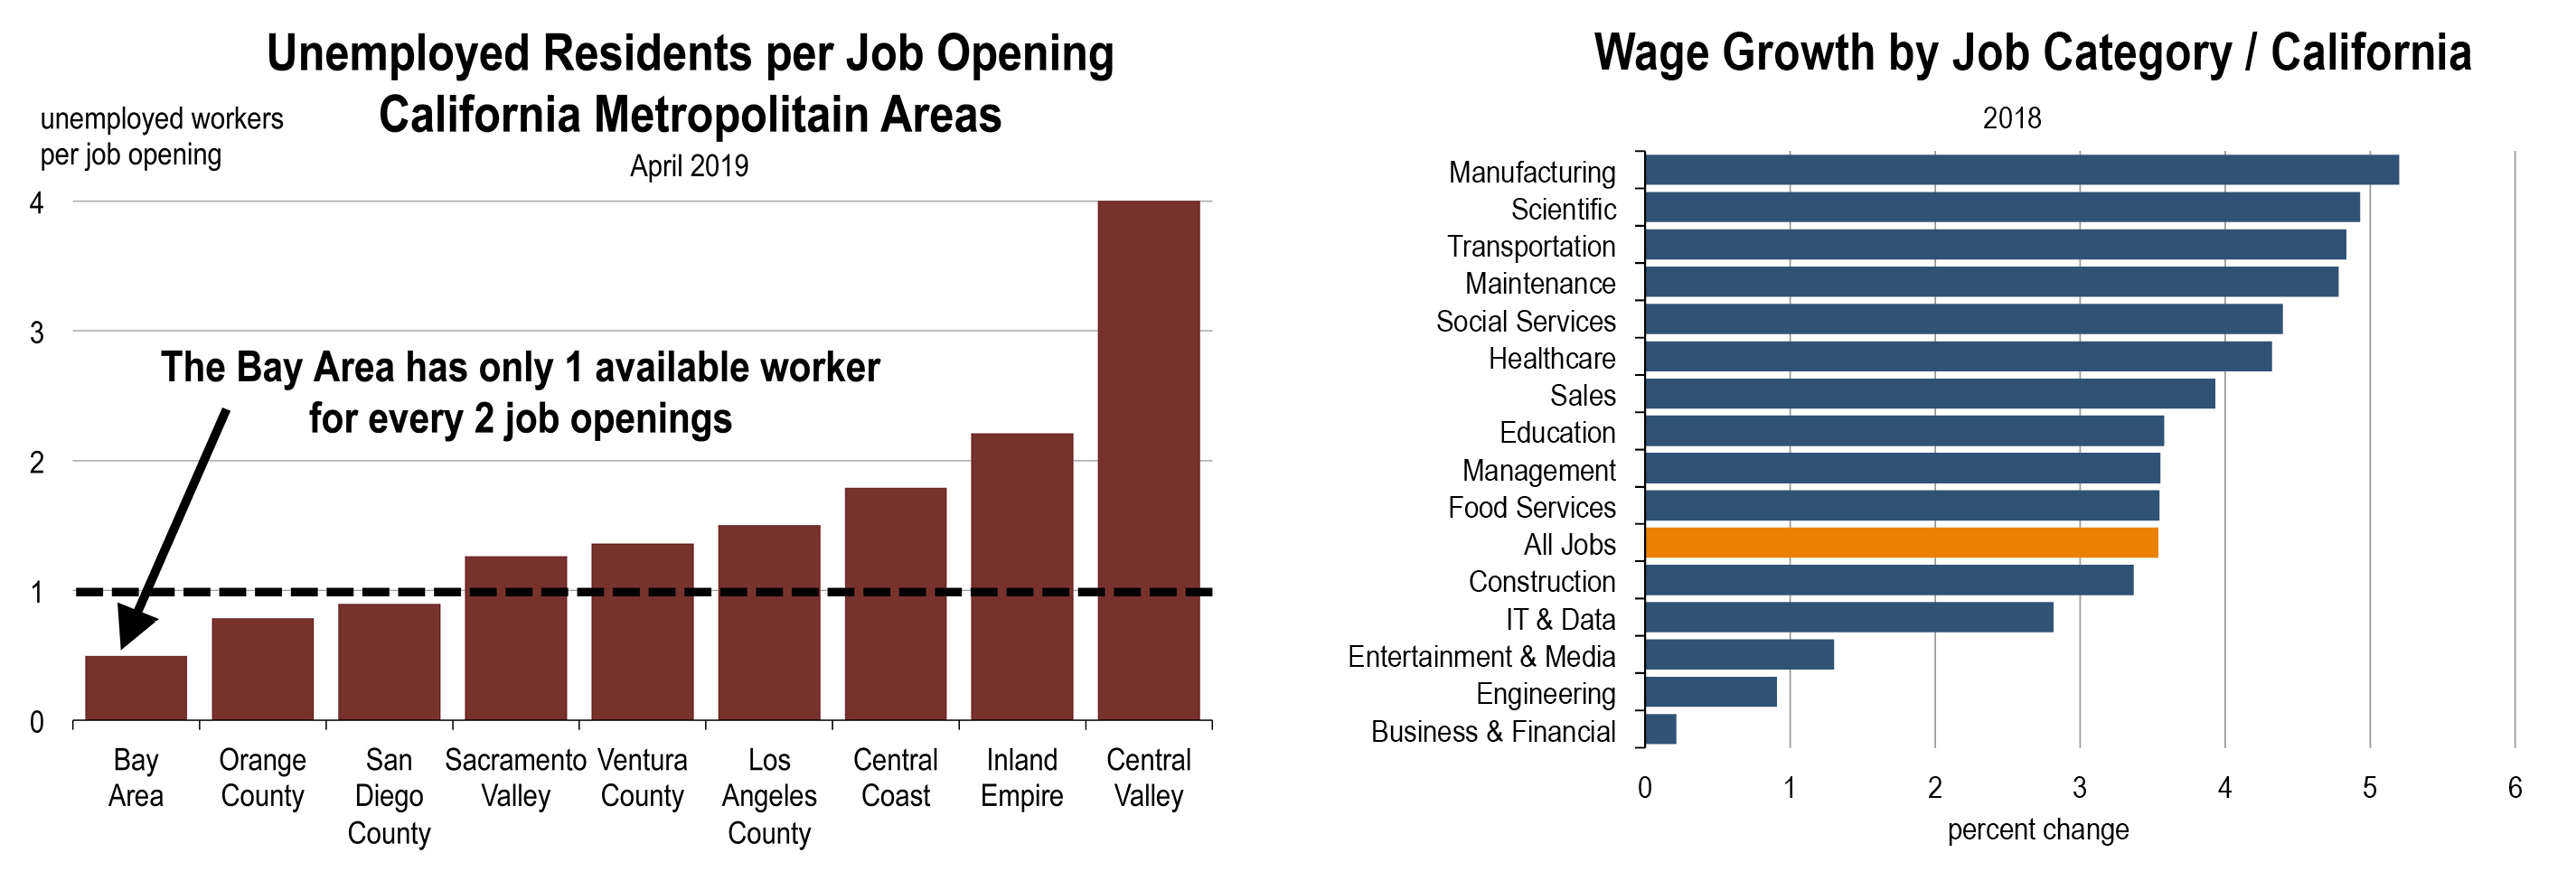
Employment opportunities won’t be the same this year as last, not because of weaker demand for workers from employers, but because employers won’t be able to find workers to fill the increasing number of unfilled positions.

That means a slower year for output and the quarterly GDP reports, unless workers become a lot more productive.

Unfilled positions that need filling lead to higher wages and salaries. So expect to receive a raise this year or expect higher labor costs for your new employees and also your existing employees in order to preempt their taking another job.

The Fed will raise rates probably four more times in 2019.

We are looking at 3.5 percent on the fed funds rate a year from now. And if the 10 year Treasury Bond yield rises to 3.8 percent, the 30 year fixed rate mortgage will go to 5.4 percent by year’s end. Long term rates are not expected to rise as much as short term rates. This can be problematic because a convergence of the two frequently presages recession in 9 to 12 months.

The direction of real estate is more highly dependent on local factors. This includes job opportunities, housing supply, and relative prices. Homes will not be selling like hot cakes in 2019. There may even be a pull back as interest rates move higher, and less inventory (or low levels of inventory) limit the number of buyers that can afford to own housing.

The product being produced is largely apartments so more people will rent. If you own apartments, demand this year should keep them fully occupied.

The stock market is not predicted to collapse. But if there is a sustained decline in valuations, this would impact consumer confidence and consumer spending in 2019 and our expectations regarding interest rate hikes would change.

The trade war with China needs to end, but it’s likely to continue for a time longer this year. Global business sentiment has declined and exports from the U.S. farm sector have declined, which has impacted farmers. Given these effects which have grown more evident during the 2nd half of 2018, more tariff hikes are unlikely and there is a greater motivation from the White House and China to end the war.

Inflation will remain contained in 2019, at less than 3 percent. Gasoline prices are falling along with food costs and these should offset increases in wages and goods impacted by higher tariffs. Housing prices are expected to level off and won’t contribute to the inflation rate.

Summary: What to Expect in 2019

Jobs created: Fewer
Job opportunities: Very strong
Unemployment: Rock bottom
Average salaries: Rising
Trade war: Ending
Stock Market: ???
Interest Rates: Higher
Inflation: Same as last year
Housing: Weaker
Recession: Highly unlikely

The California Economic Forecast is an economic consulting firm that produces commentary and analysis on the U.S. and California economies. The firm specializes in economic forecasts and economic impact studies, and is available to make timely, compelling, informative and entertaining economic presentations to large or small groups.

Though Now Legal, Cannabis Sales (and Taxes) are Not Yet Meeting Expectations in California

by Mark Schniepp
December 2018

Licensing for Cultivation

California launched legal recreational marijuana sales and began licensing all other industry businesses including cultivation for the first time on January 1, 2018.

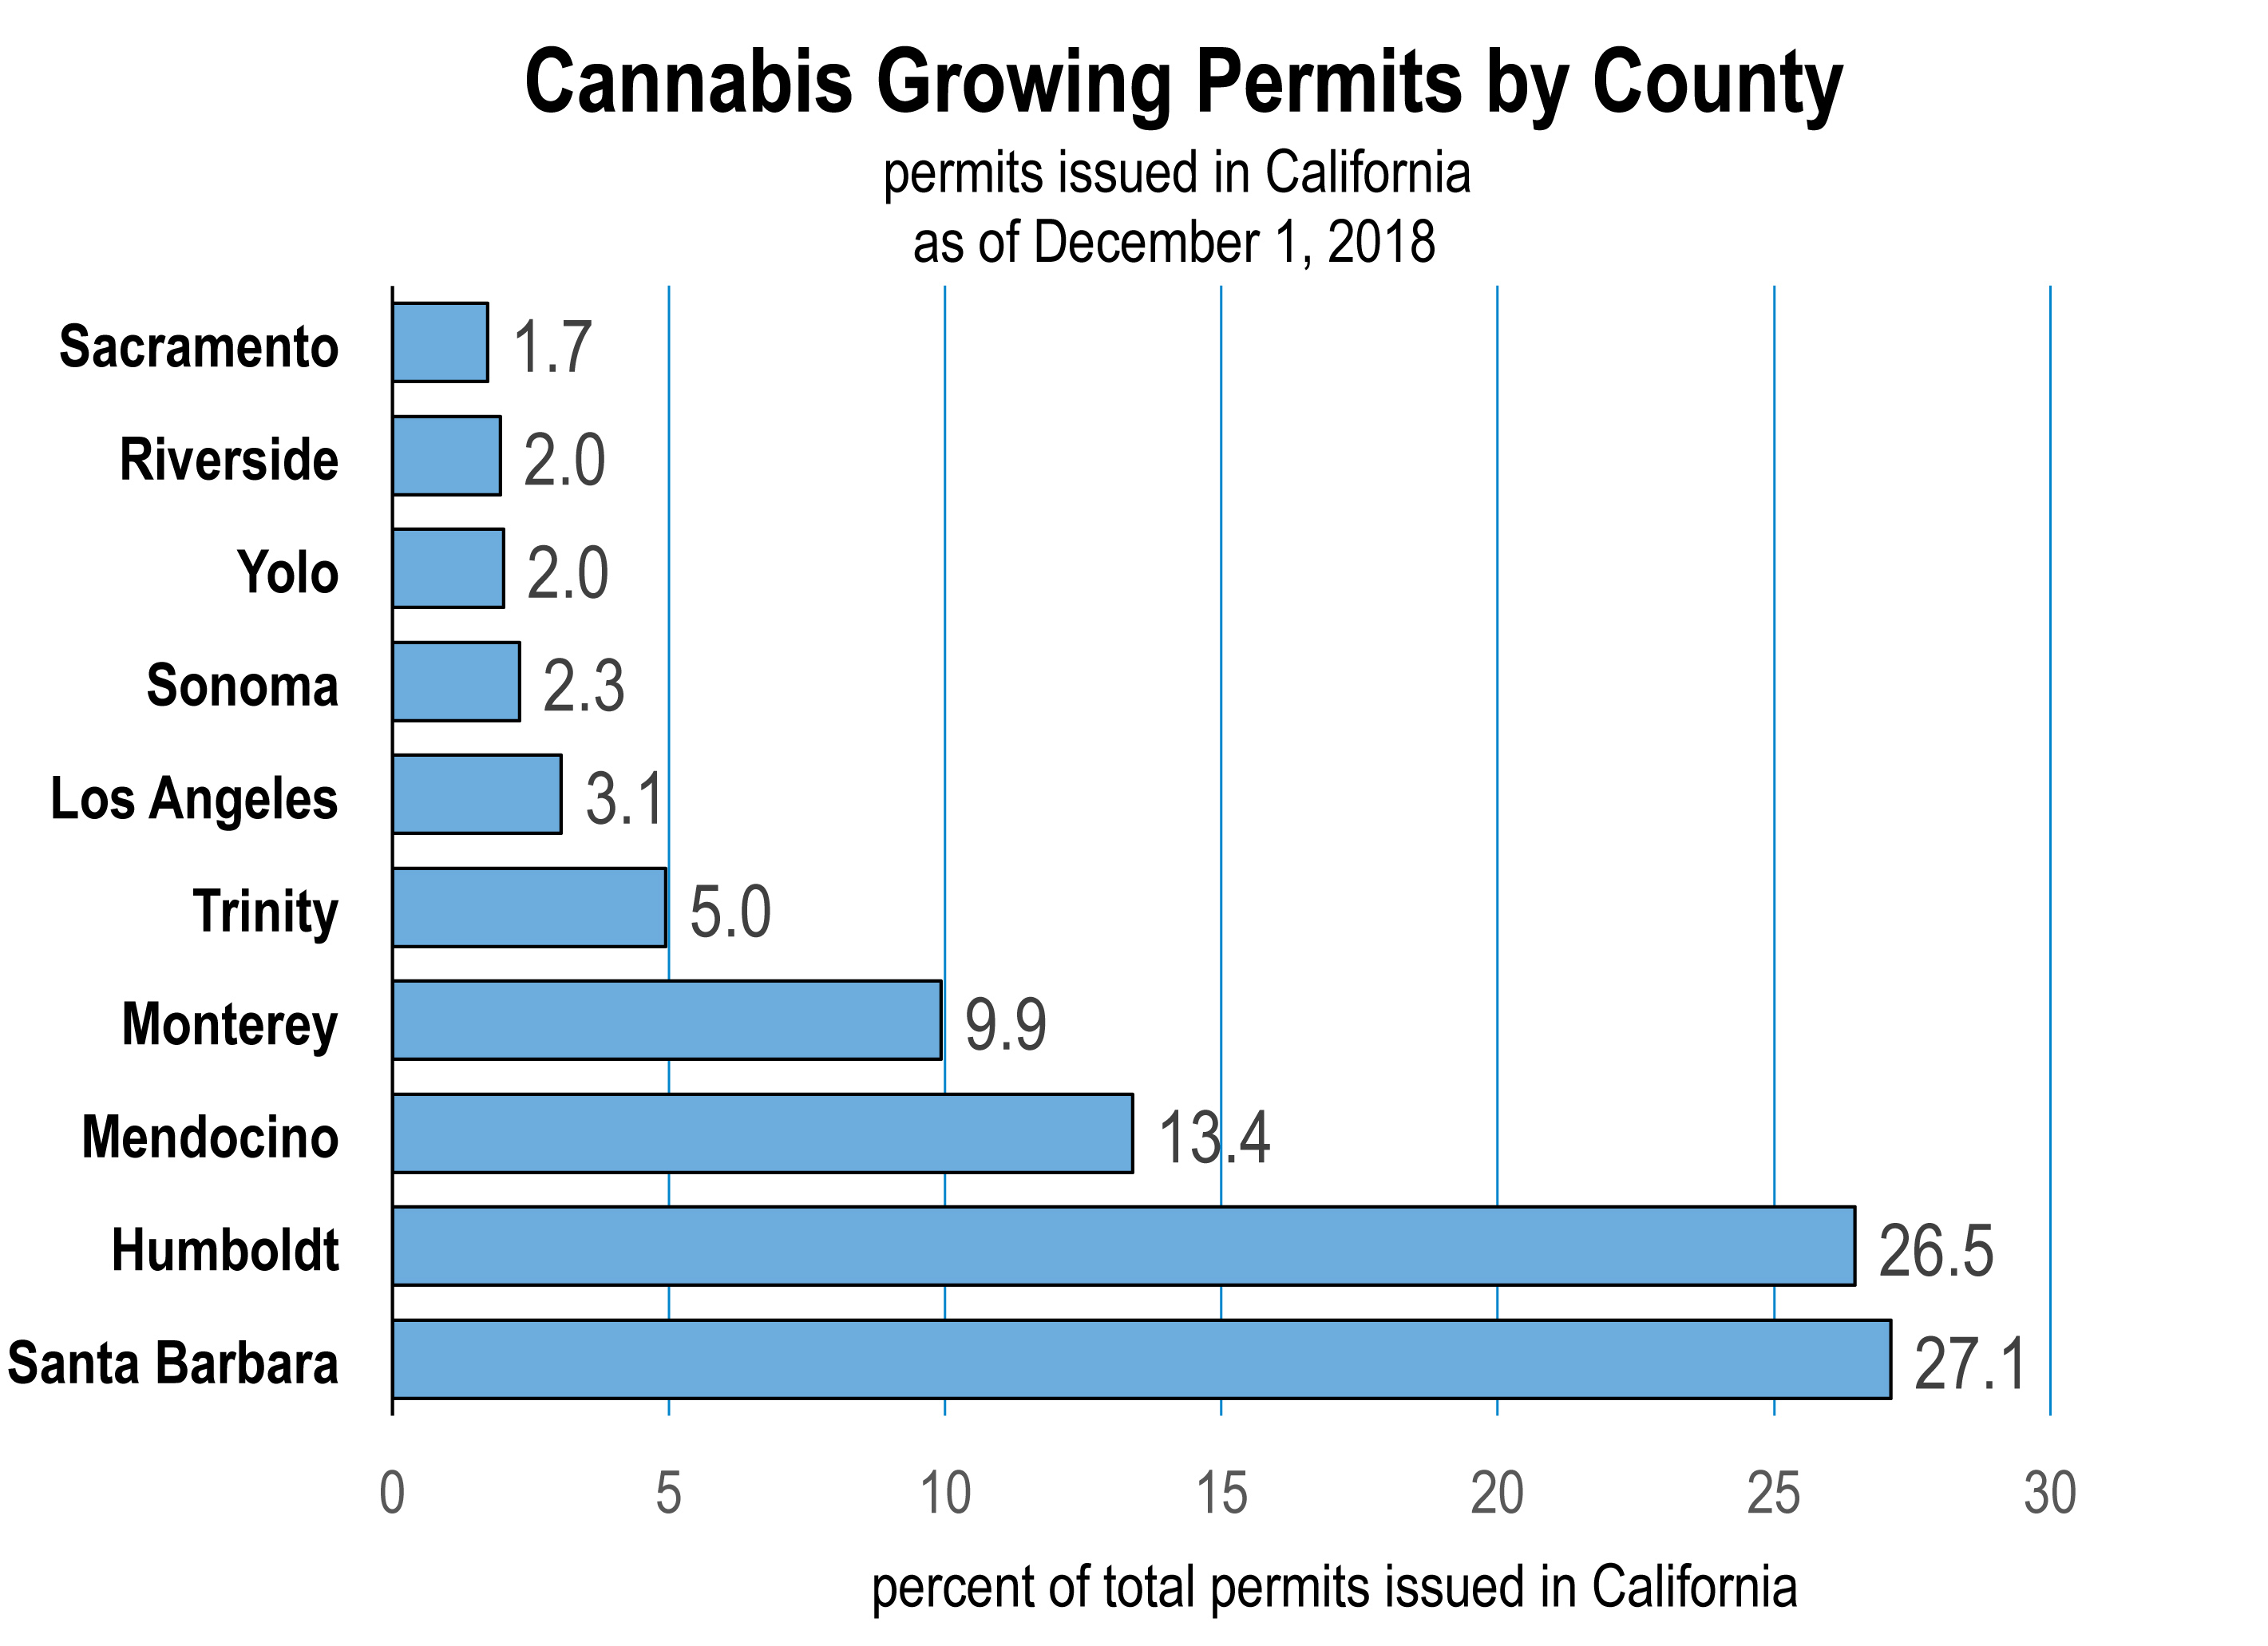
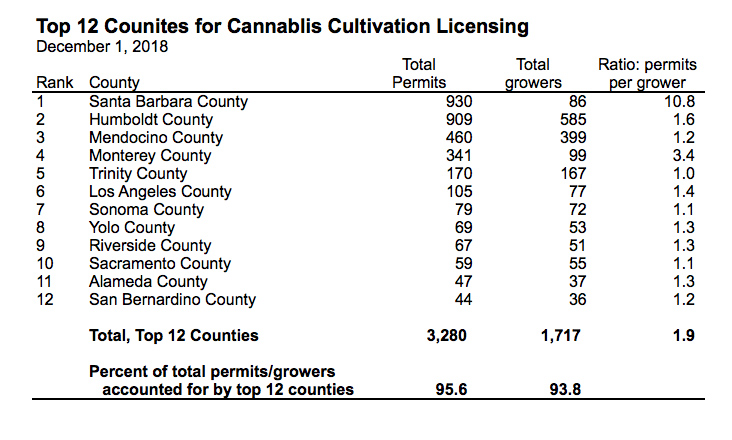
Permits for licensed cannabis cultivation have been issued throughout California over the last 11 months. To date, 5,871 outdoor and indoor permits have been issued and as of December 1, 2018, 3,432 are currently active.

It is the large scale cultivation operations that have emerged in California this year, acquiring dozens of licenses for smaller growing sites which they can combine into a single cultivation area. While there have been nearly 6,000 permits issued to grow cannabis, the total number of unique growers is only 1,830.

Each small cultivation license enables a growing space of up to 10,000 square feet. But a grower can obtain an unlimited number of these licenses.

This is especially true in Santa Barbara County, where more licenses have been issued than anywhere else in California, and the ratio of licenses to unique growers is 10.8 to 1.

Legal Participation in Cannabis Cultivation is Seriously Low

A recent study estimated the number of total growers in California at 68,150 in 2017.1 Consequently, if 1,830 unique growers have applied for and received cultivation licenses in 2018, this represents a statewide grower participation rate into the legal regulated market of just 2.7 percent.

In other words, the black market where most of the growers remain is seriously thriving despite the ability to become legal.

Tax Revenues in 2018

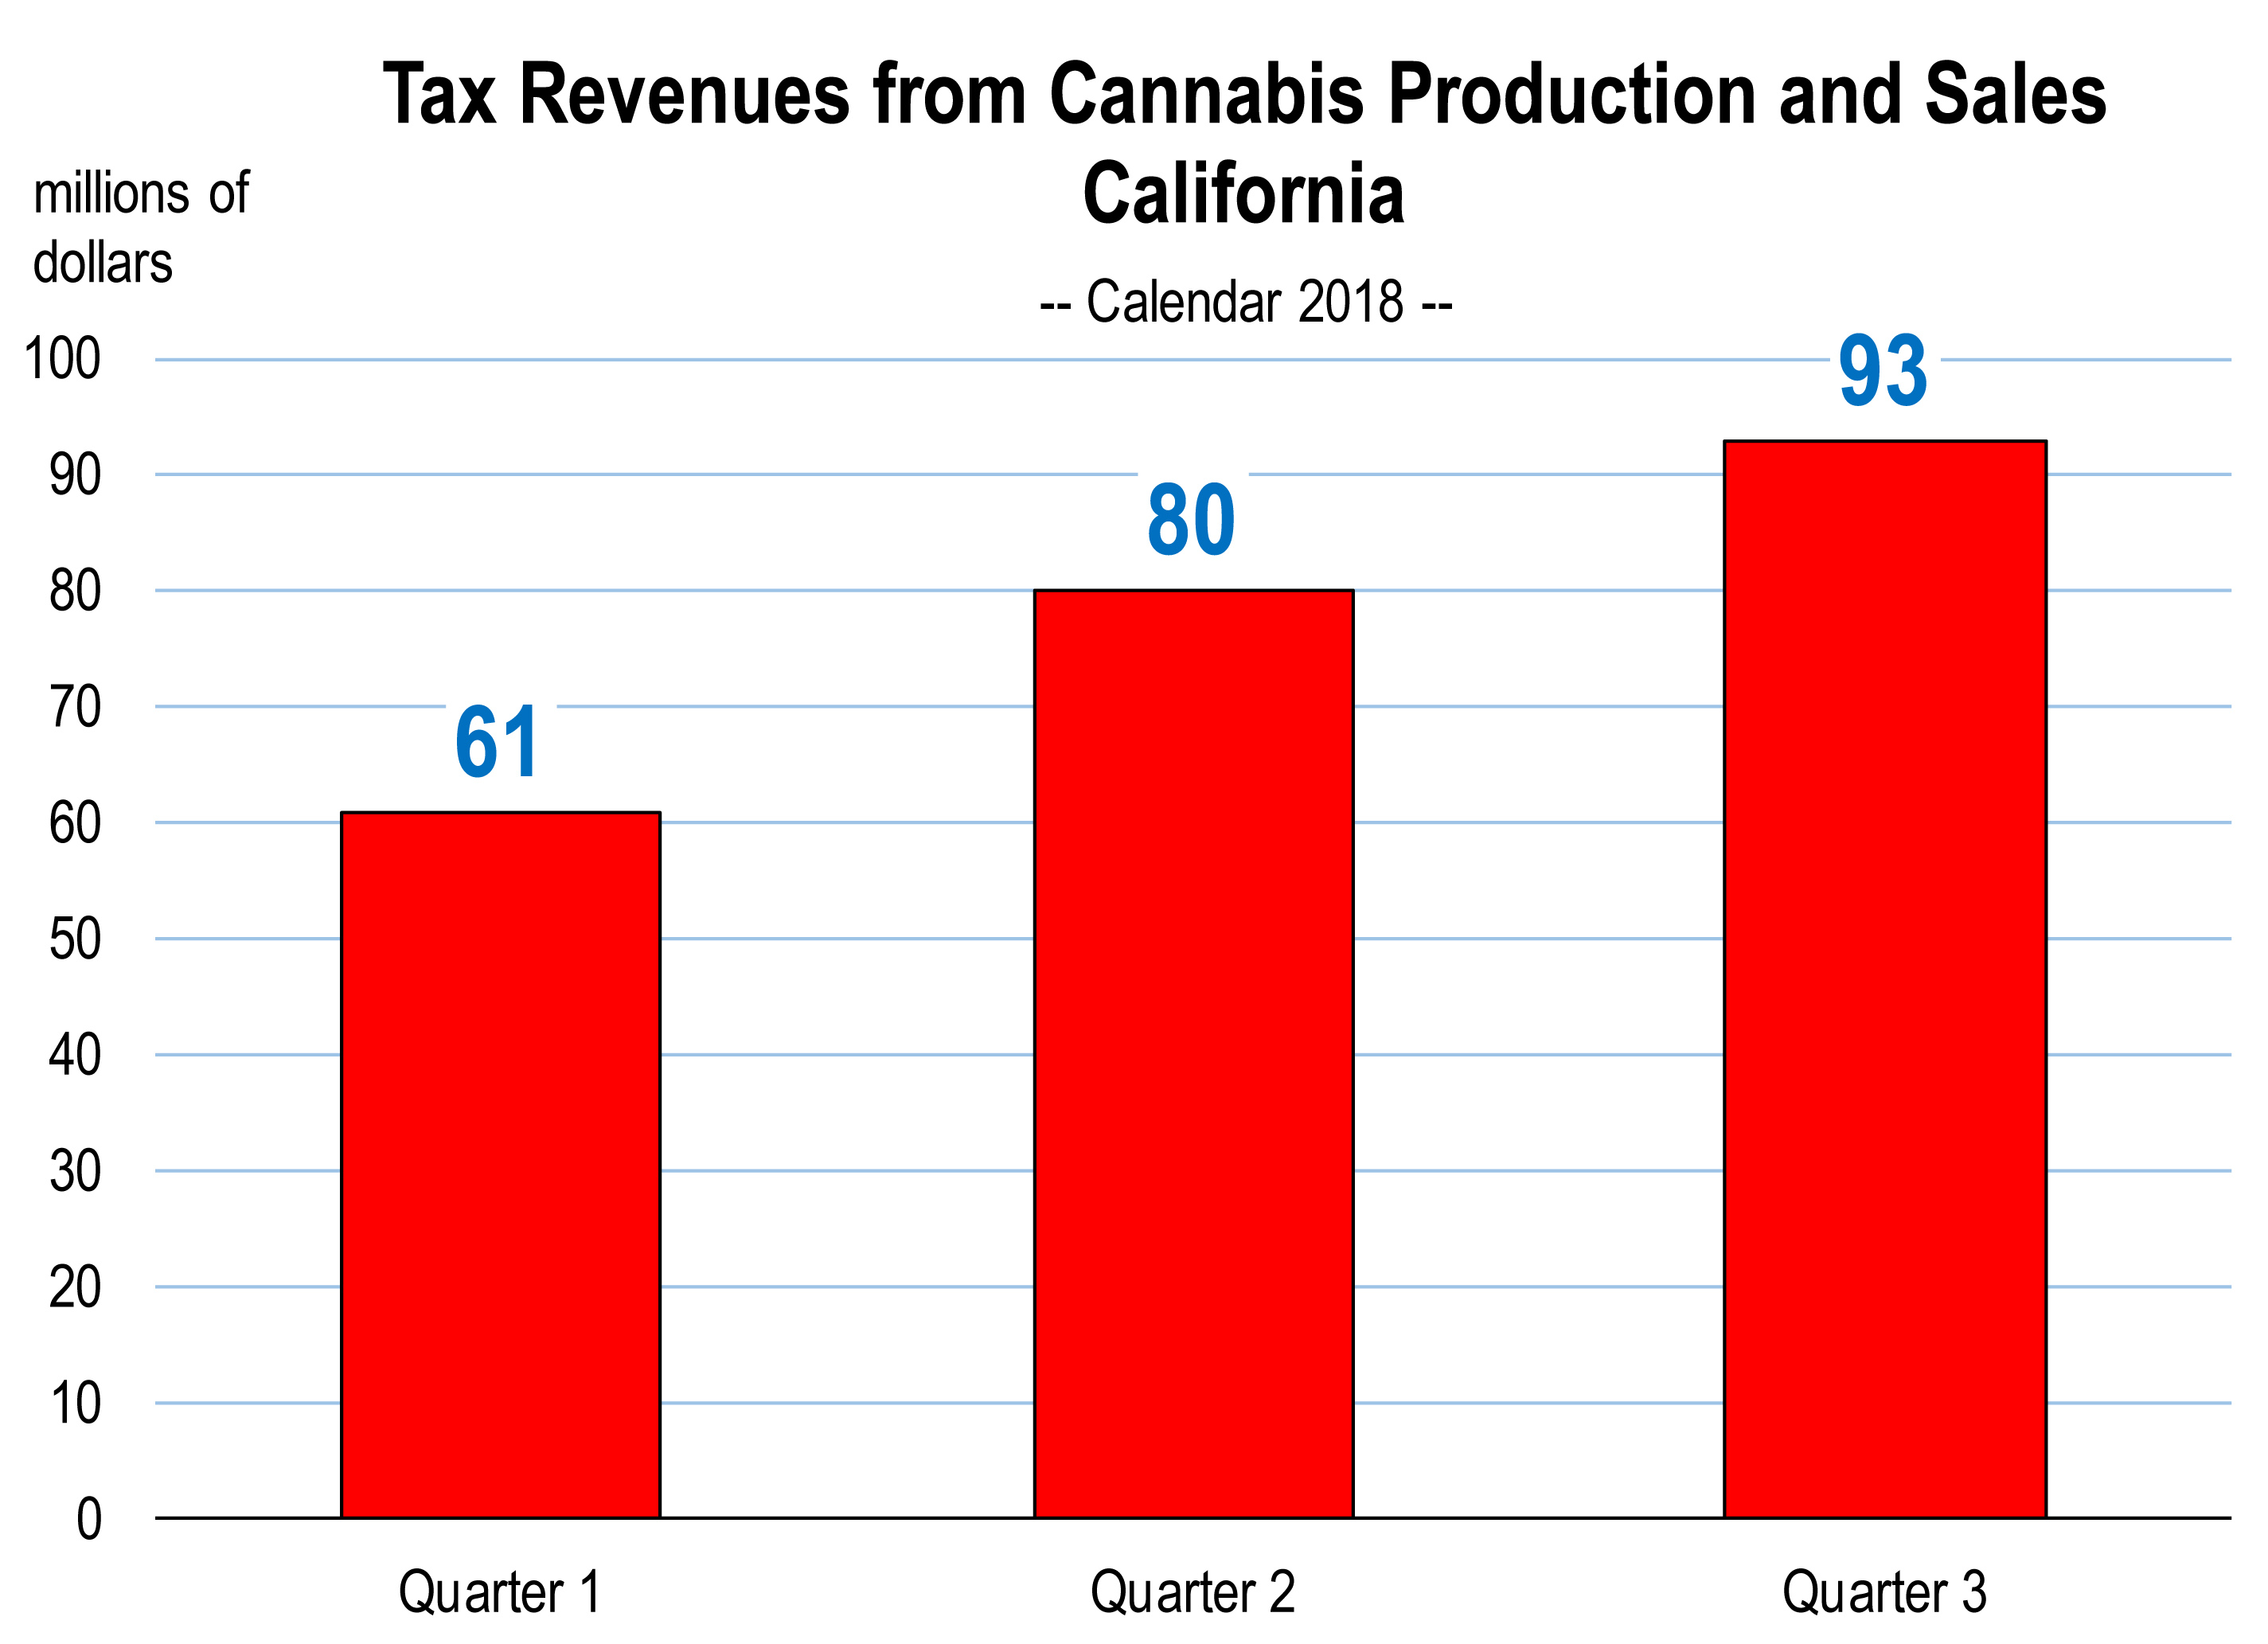
In January of this year, Governor Brown predicted annual tax revenues going to California at $643 million for the first year of legal cannabis production and retail sales. Taxes on cannabis pertain to both growing and retail sales of marijuana and derivative products.

However, during the first 3 quarters of 2018, total tax revenue collection has fallen short of expectations. At the current rate of tax receipts realized through September, it’s likely that just over half of the Governor’s tax revenue goal for calendar 2018 will be realized.

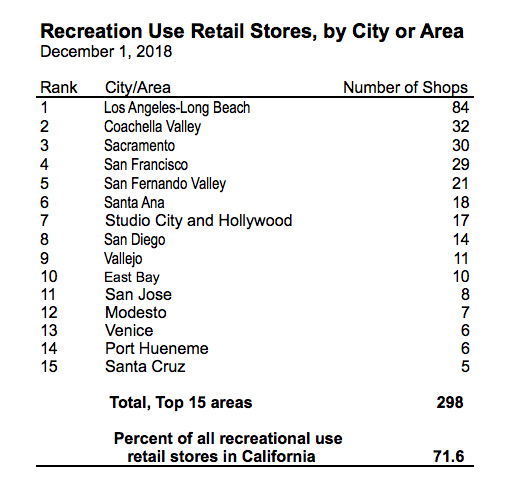
Why? The lack of grower participation to date is the biggest reason, along with a scarcity of recreational use cannabis shops in California. So far, there are 416 storefronts that have been licensed to sell cannabis and derivative products for recreational use in California. Thirty five percent of these are located in the greater Los Angeles metro area. The Coachella Valley is number 2 with 32 stores in Palm Springs, Cathedral City, and Desert Hot Springs. San Francisco is third but with much fewer outlets.

Along Interstate 5 between San Francisco and Los Angeles, adult-use shops are nearly nonexistent. There are no stores in Fresno, Kern, San Joaquin, San Luis Obispo, Placer or Nevada Counties. And there are only a few shops operating along the Central Coast of California.

In general, there are not enough establishments that are now open to conveniently serve the state’s population and generate tax revenues for the state. Why? Local prohibitions on adult use marijuana stores are a principal reason. You can only buy legal cannabis products in legally sanctioned retail outlets if they are permitted in your city or county. Even though Proposition 64 was approved in 2016 by about 57 percent of the state’s electorate, most cities in California still refuse to permit marijuana businesses. About 84 percent of cities in the state have banned adult-use retailers, whether storefront or deliveries. Right now, only 77 cities in California allow recreational sales of cannabis.

Prices

And then there is the price. Regulation and taxation is having a large impact on consumer prices. Though the wholesale price for leaf and flowers has fallen precipitously in the last year, prices for retail cannabis products in stores have not.

New packaging and testing regulations went into effect on July 1, 2018 and this has created confusion for regulated store owners, reduced product and increased prices.

And according to industry sources, the unlicensed (or black) market sells cannabis products for lower prices. In August, a marketing survey found that one in five Californians bought marijuana from black market sources and were “highly likely” to purchase again due to cheaper priced products, greater selection, and no tax.2

According to PriceOfWeed.com, this week’s average price per ounce for high quality marijuana is $256.63. For medium quality, the price drops to $207.13.3

The State of California has the second highest tax rate on cannabis growing and sales in the country, behind the State of Washington. Together with city and county taxes, the gross tax rate of cannabis products can go as high as 45 percent in California.

There was a proposal in the state legislature, Assembly Bill 3157, that would have lowered the state’s excise tax imposed on purchasers of cannabis from 15 percent to 11 percent for about three years. It also would have suspended the cultivation tax until June 1, 2021. But it did not have the support of Democrats and unions.

Last Word

The first year for the industry has been bumpy as the regulatory issues become institutionalized and applied. Combined tax rates on cultivated product and on retail sales are comparatively high and compliance standards onerous. For this reason, most California growers remain in the unregulated market.

More regulations on packaging, product uniformity and testing and fewer retail storefronts throughout California (due to local city and county bans) are pushing final product prices to the upside. Consumers are still seeking out less costly products and the black market is still thriving.

California cannabis industry conditions are evolving and it’s likely that the environment for growers and retail sellers will improve, together with tax revenue collections for the state and for municipalities. But currently, the regulated market is struggling with grower licensing, retail product shortages due to testing delays and distribution issues, and higher product prices (than the black market).  So as the first year of legal cannabis growing and sales sunsets on California, the industry is still in a state of flux.

__________

1 California Growers Association, “An Emerging Crisis: Barriers to Entry in California Cannabis,” February 19, 2018, page 6.

2 Investor’s Business Daily, https://www.investors.com/news/marijuana-stocks-california-cannabis-tax-revenue-q2/

Also see https://mjbizdaily.com/higher-prices-and-barer-shelves-california-cannabis-retailers-face-frustrated-customers/

3 For a sample size of 21,179 transactions. See the home page of http://www.priceofweed.com


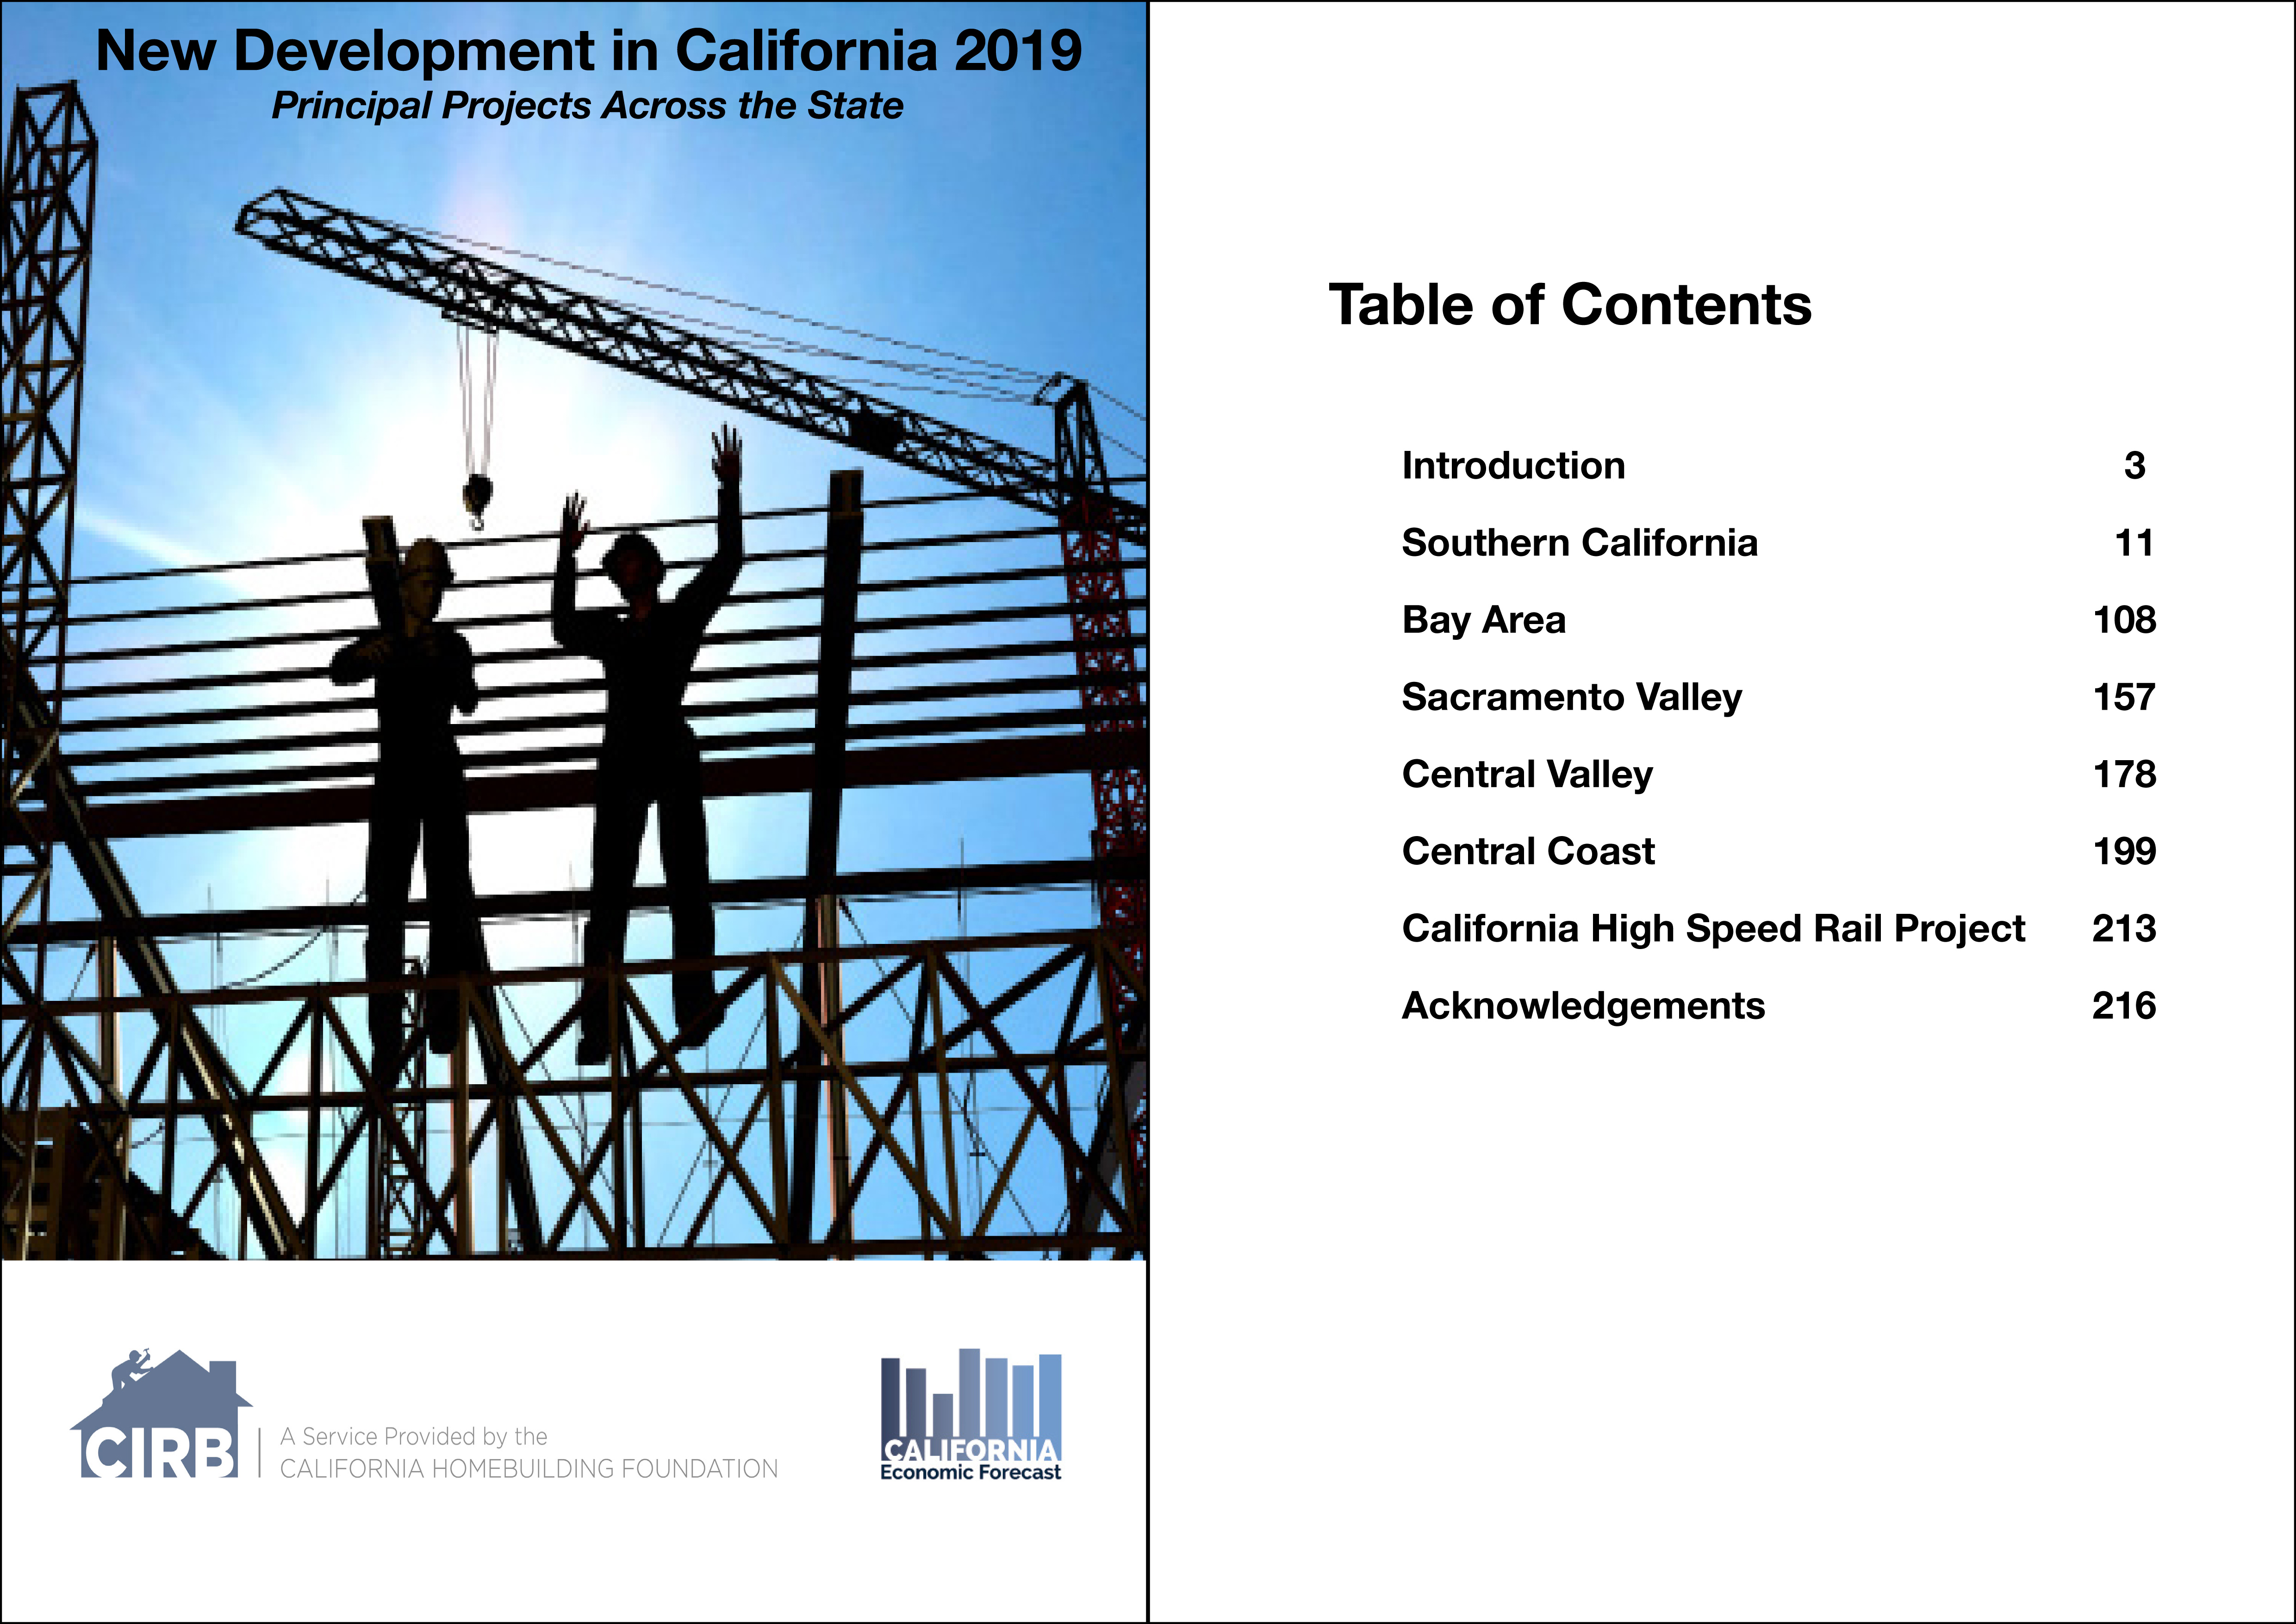
The 2019 Edition of the New Development in California report will be available in late December, 2018. For more info, view our website here.

The report documents the principal residential and non-residential building projects in California. This is a must-have report for all construction and building material contractors, and anyone who needs to understand the new development environment in California.

The California Economic Forecast is an economic consulting firm that produces commentary and analysis on the U.S. and California economies. The firm specializes in economic forecasts and economic impact studies, and is available to make timely, compelling, informative and entertaining economic presentations to large or small groups.

What You Should Know About the Longest Expansion in Modern U.S. History

by Mark Schniepp
November 2018

1. The economic expansion is only 8 months away from becoming the longest on record

The record 1990 to 2000 expansion will be eclipsed in July 2019. That will put the current expansion at 121 months, or 10 years plus a month. It is likely that the expansion will continue throughout 2019 and into early 2020.

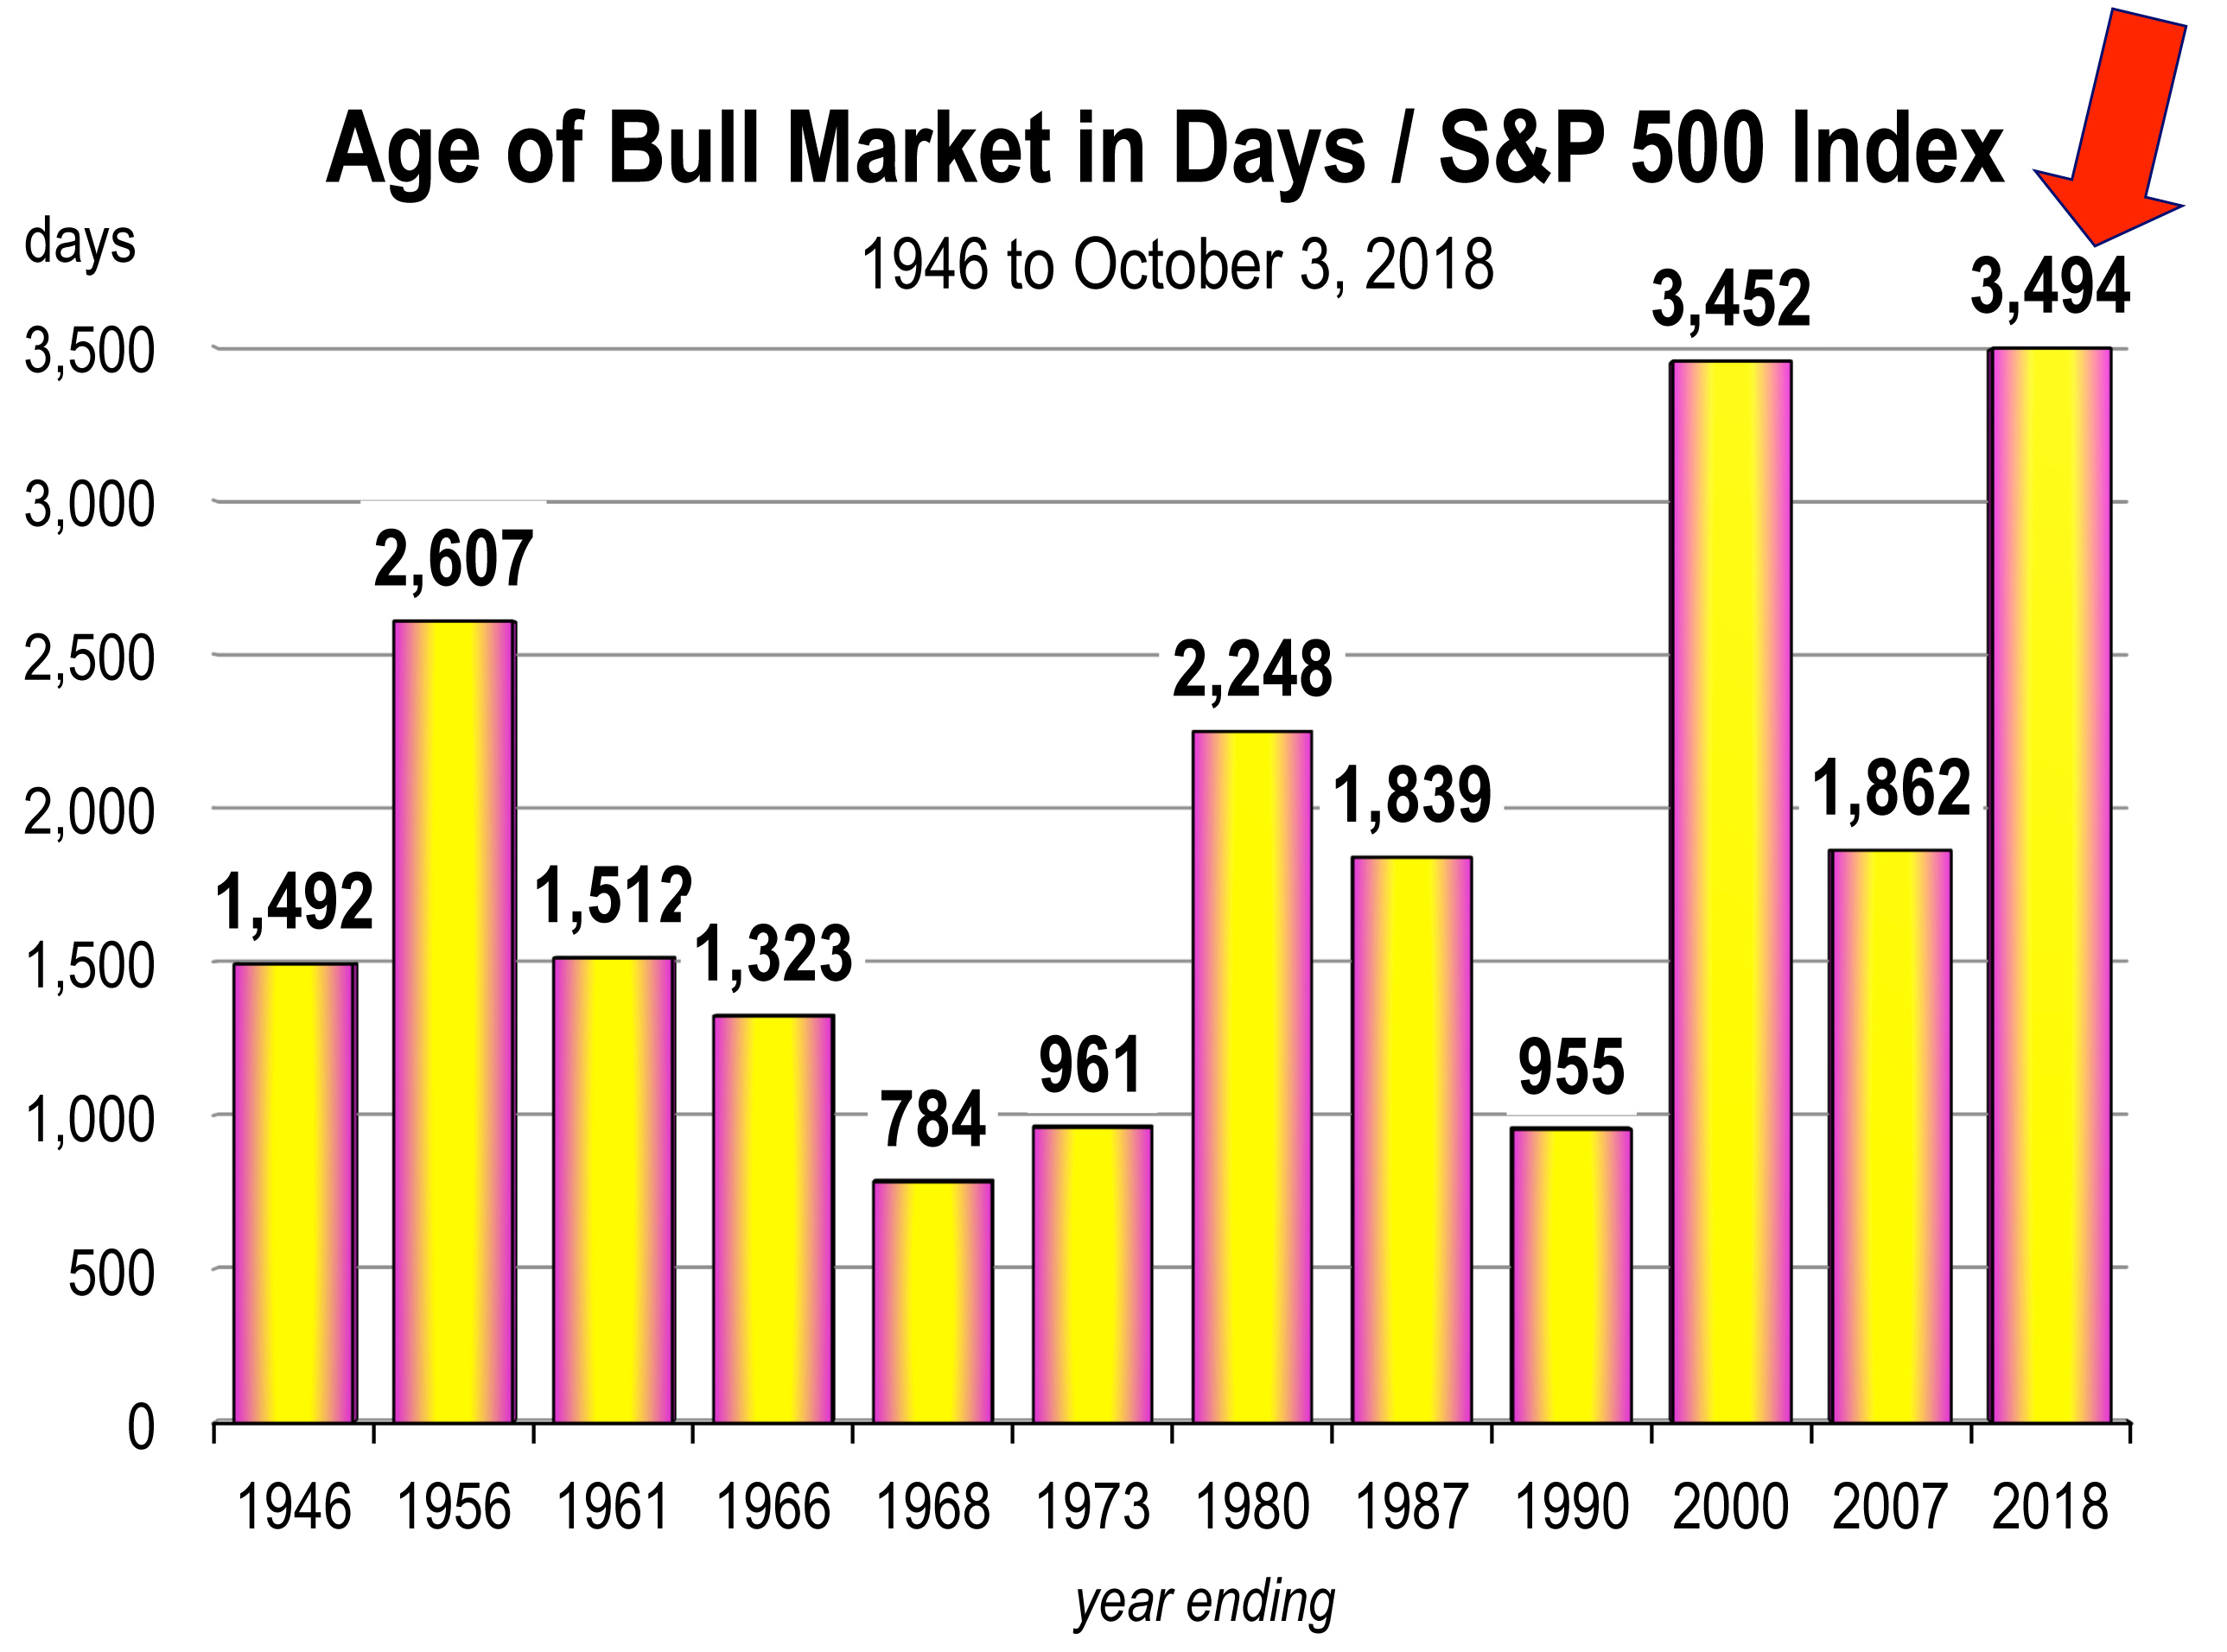
The bull market in stock prices set a new record for longevity. A total of 3,494 days from March 10, 2009 to October 3, 2018 eclipsed the previous record of 3,452 days during the 1990 to 2000 stock market run.

If the S&P index reaches another record high, the current pull-back represents a temporary pause and the long bull market would be extended.

2. GDP growth has accelerated this year, akin to a breakout

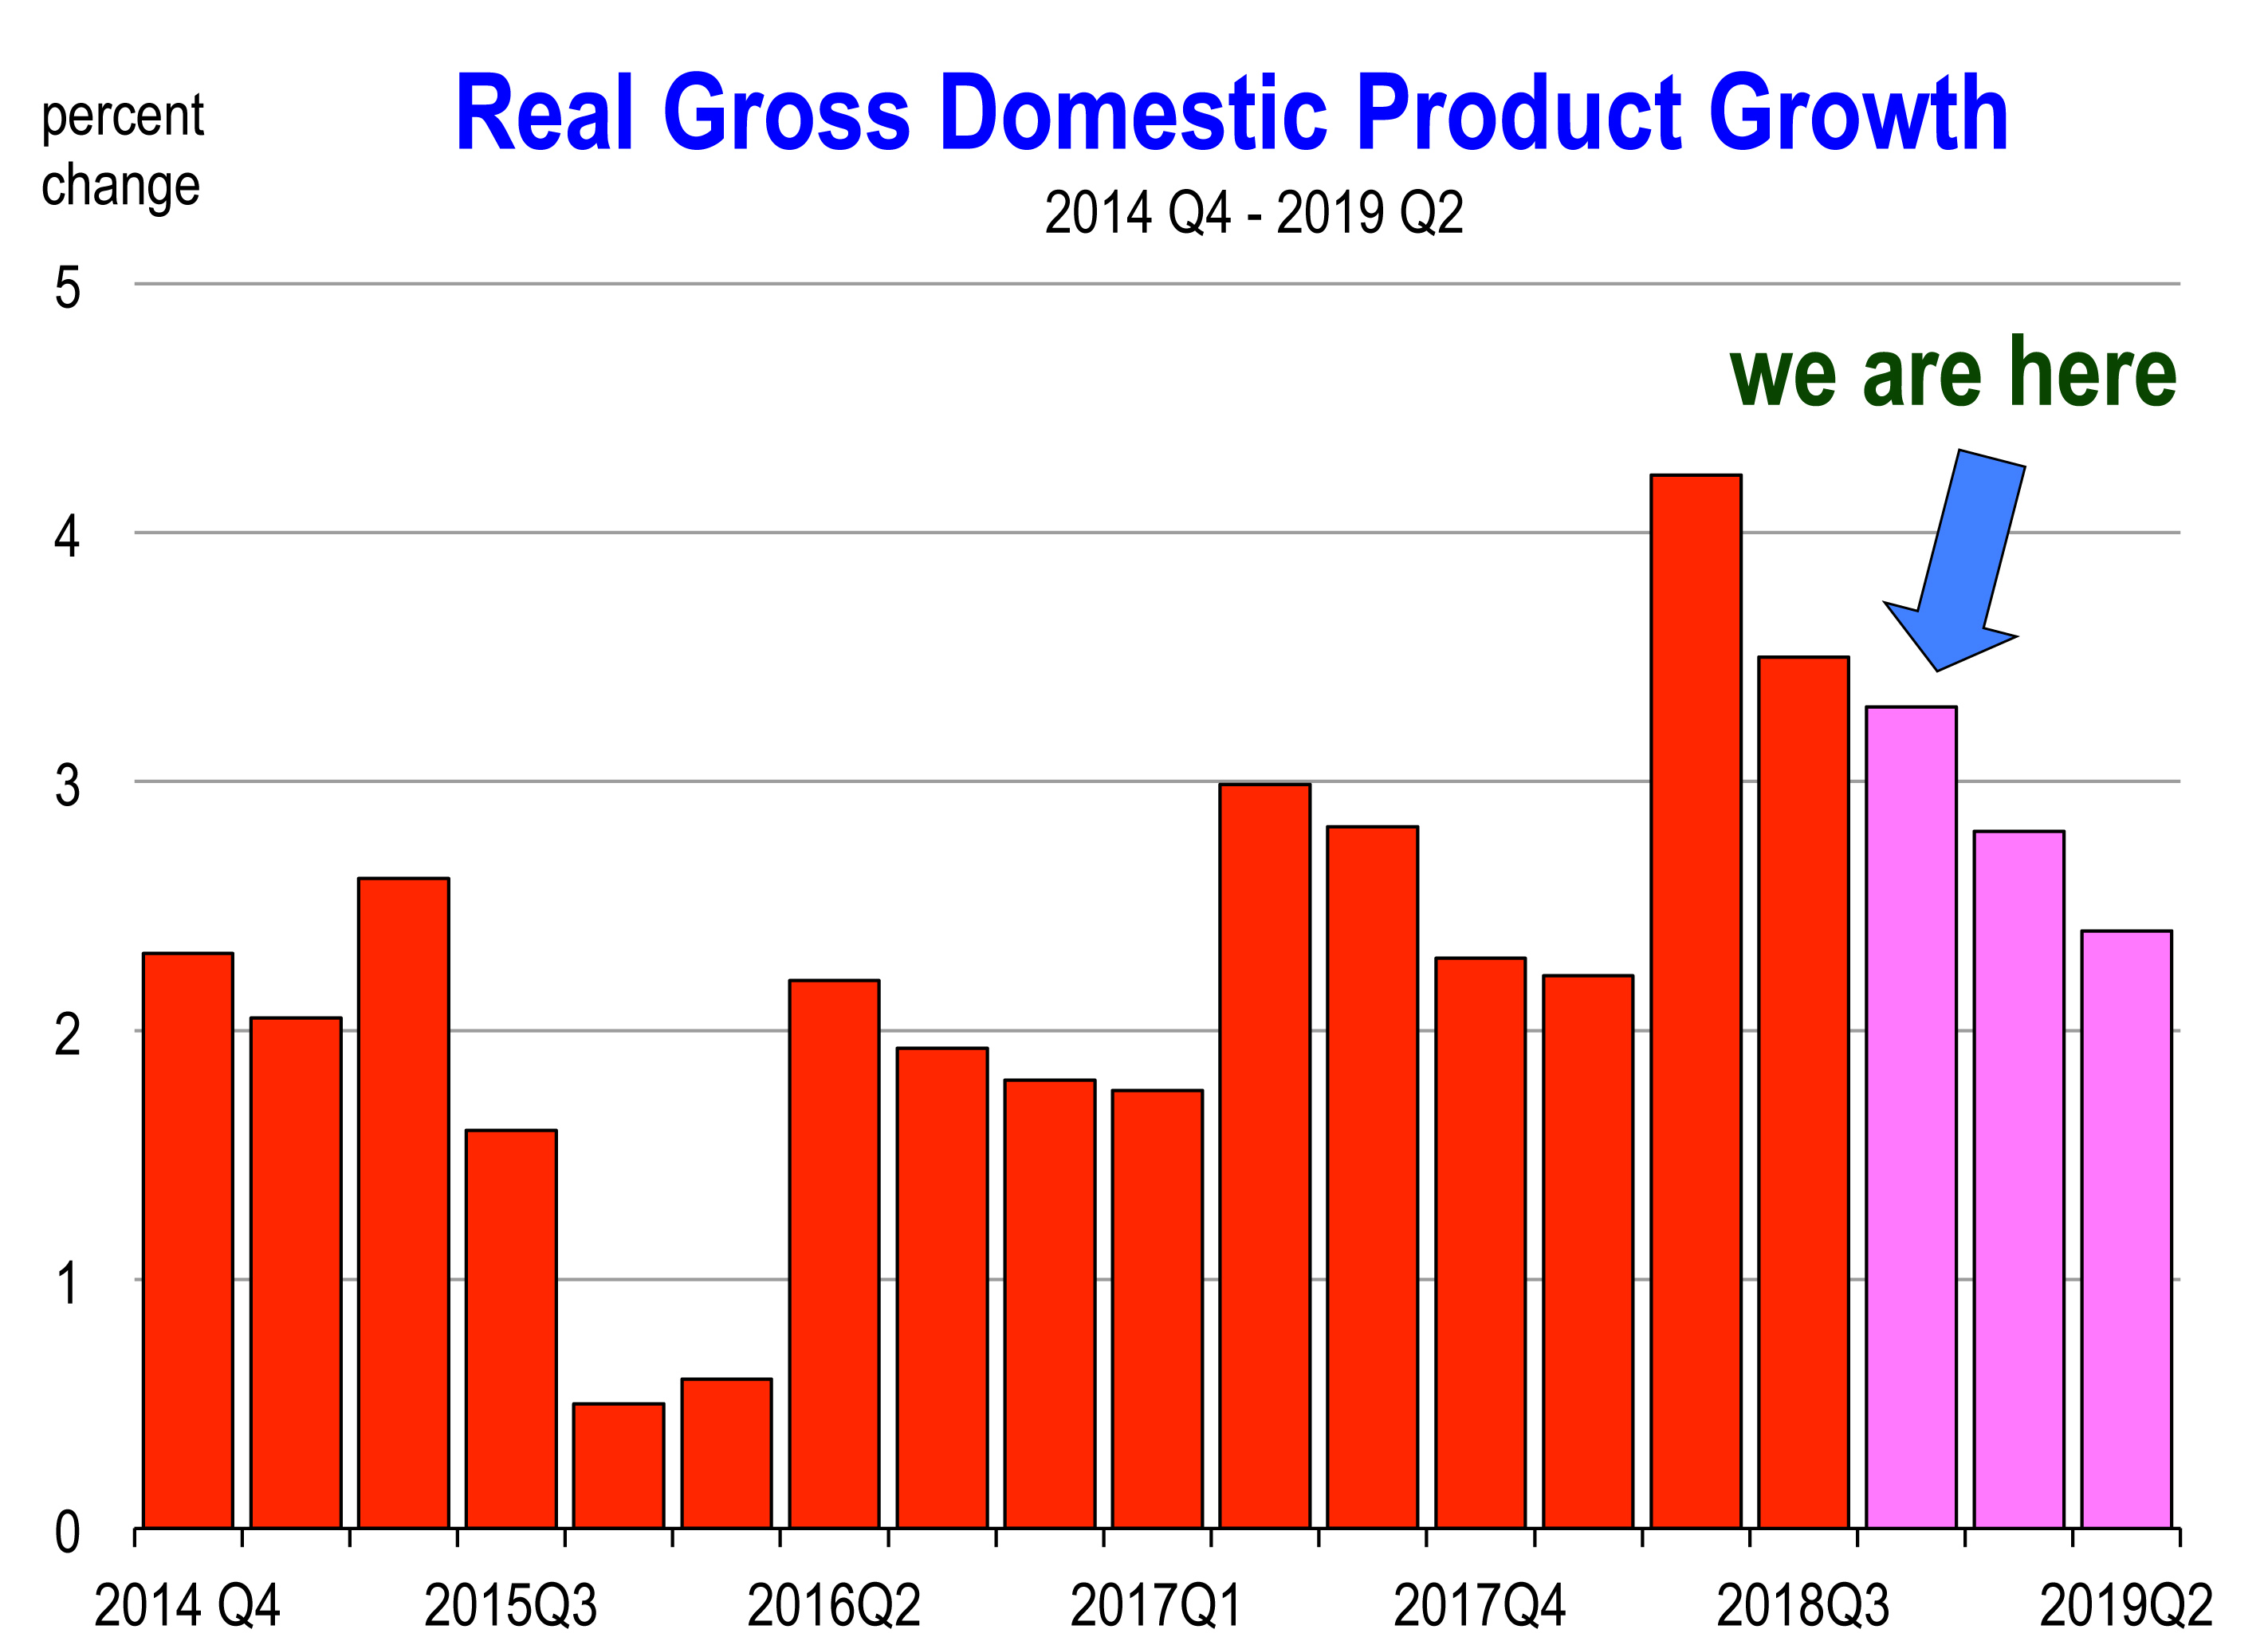
And this is unusual at this late stage of the expansion because the strongest surges of growth normally occur the recovery phase of the cycle. GDP growth jumped to 4.2 percent in the 2nd quarter and the initial estimate for the 3rd quarter is 3.5 percent. We estimate a 3.3 percent growth rate for the quarter that we are in now.

3. The economy’s labor force is fully employed

The nation’s unemployment rate of 3.7 percent is the lowest rate of unemployment since 1969.

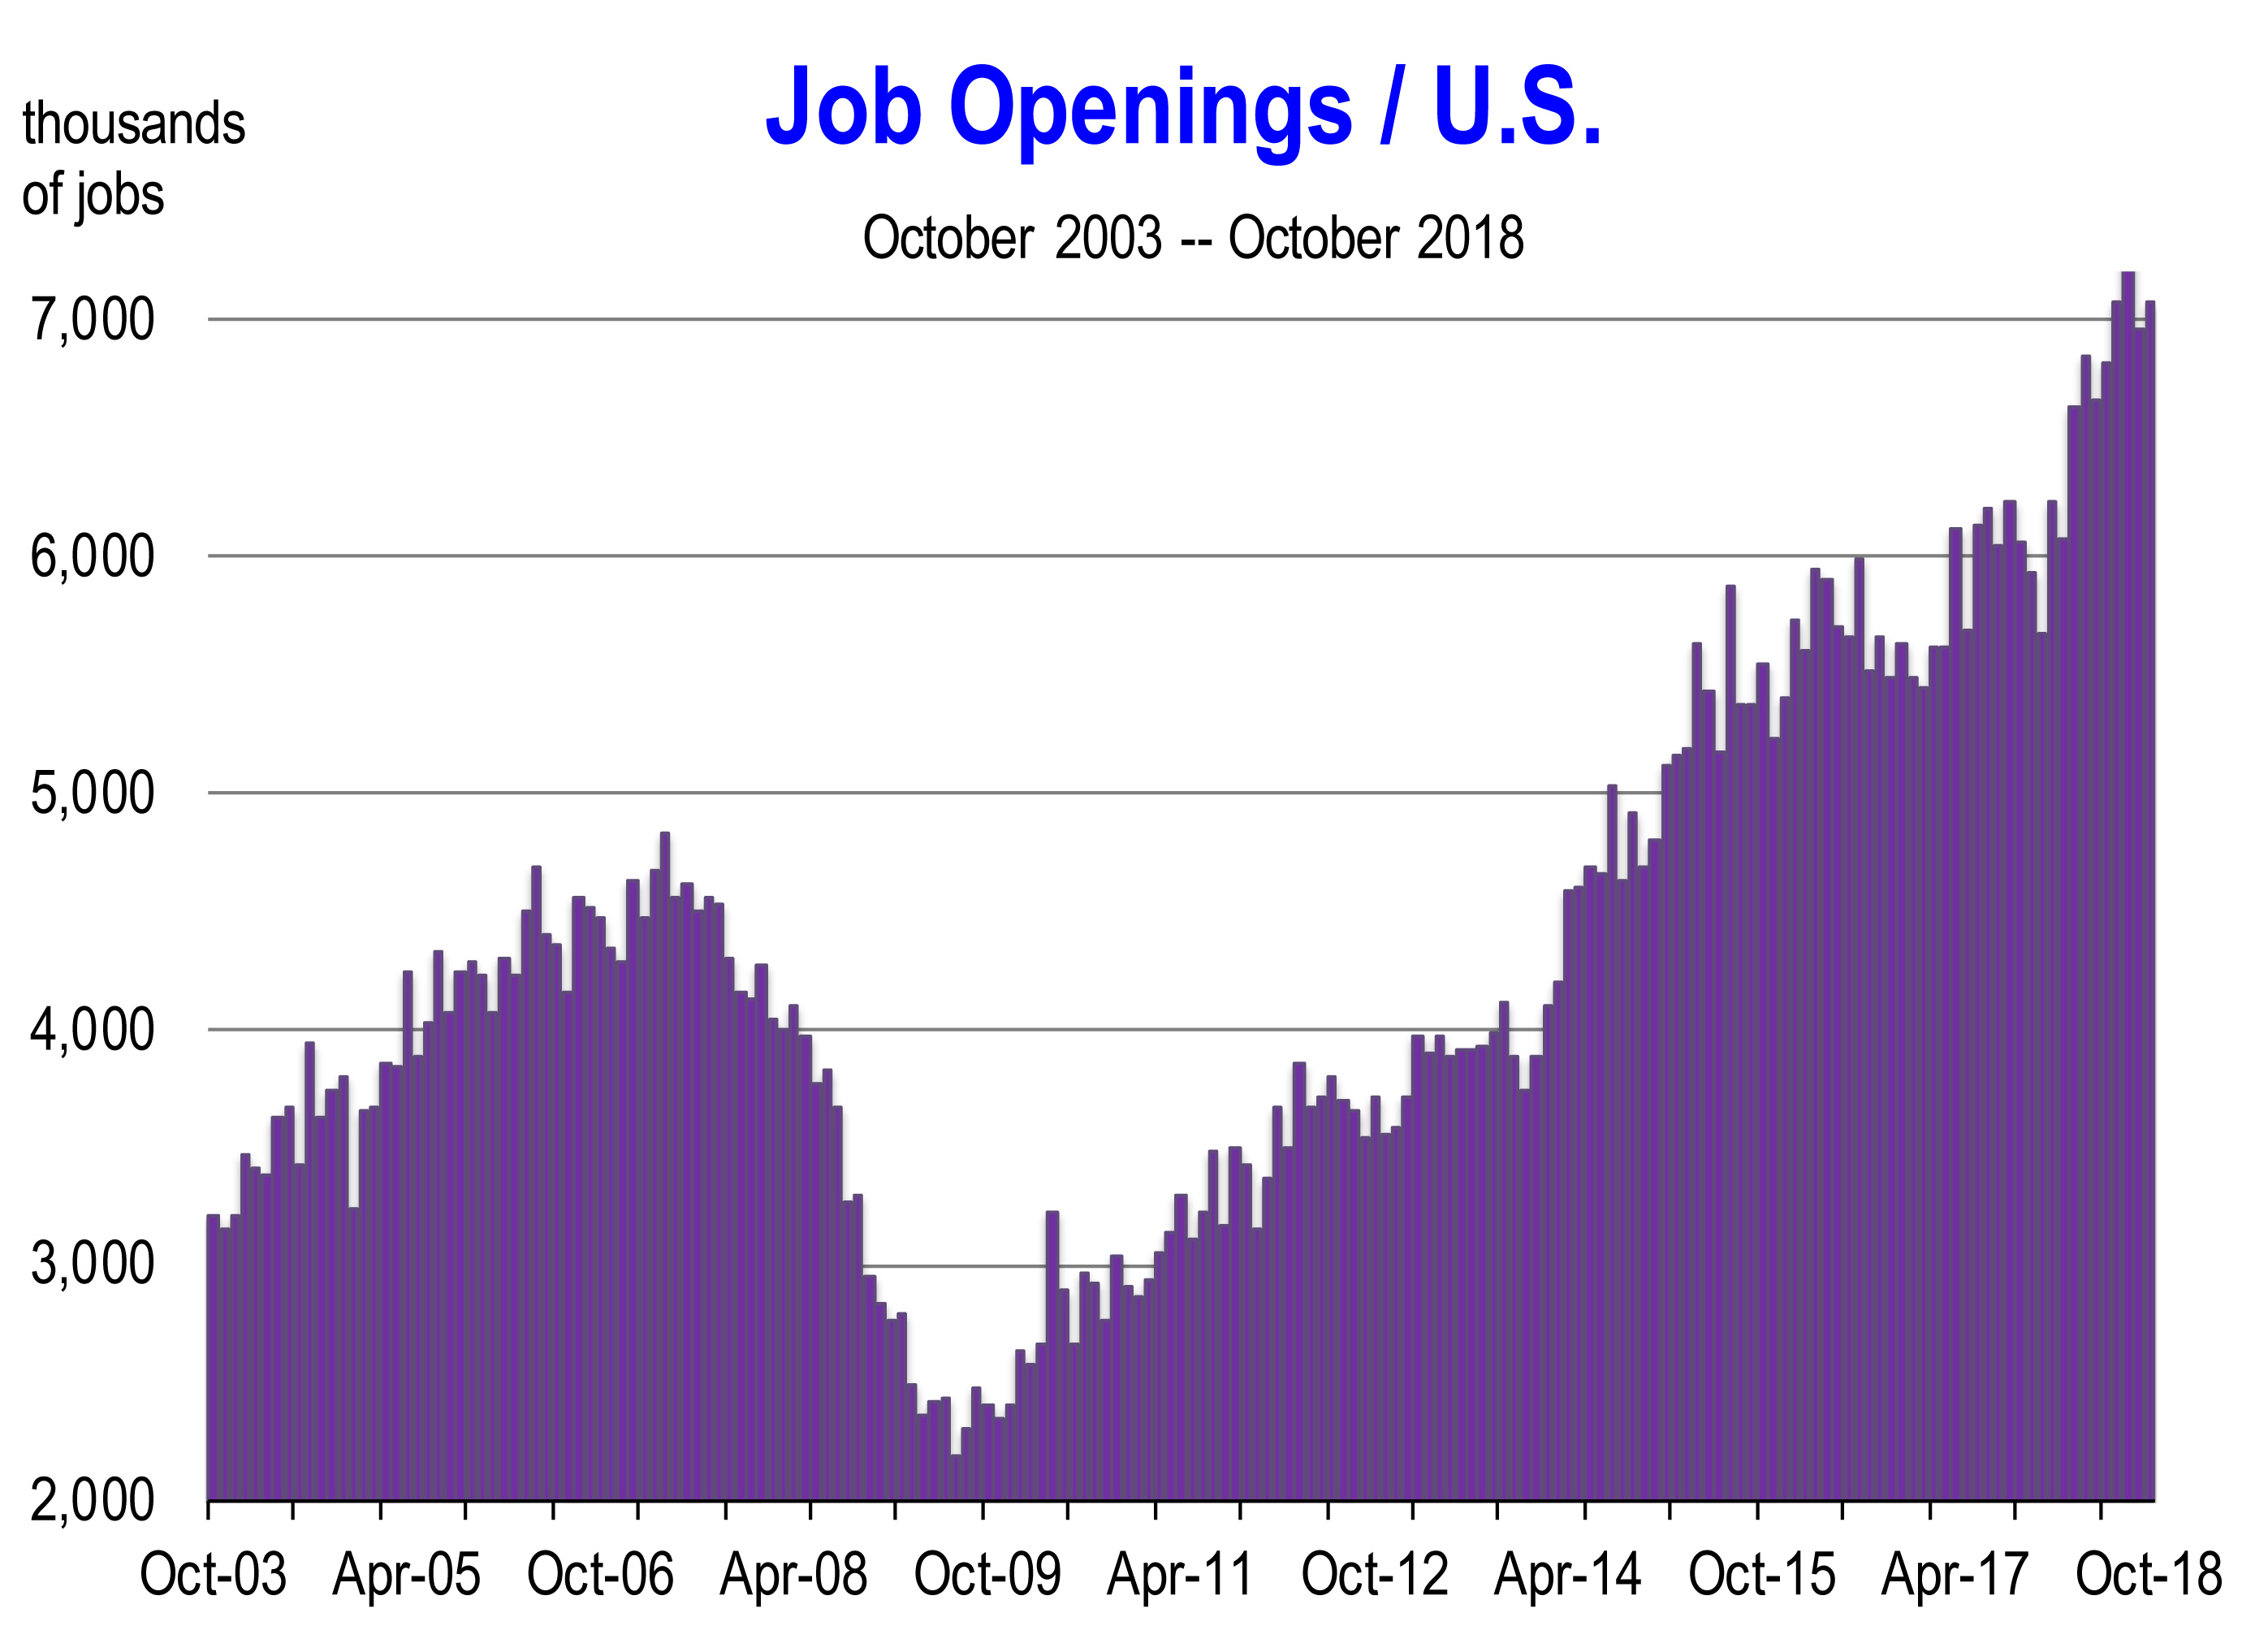
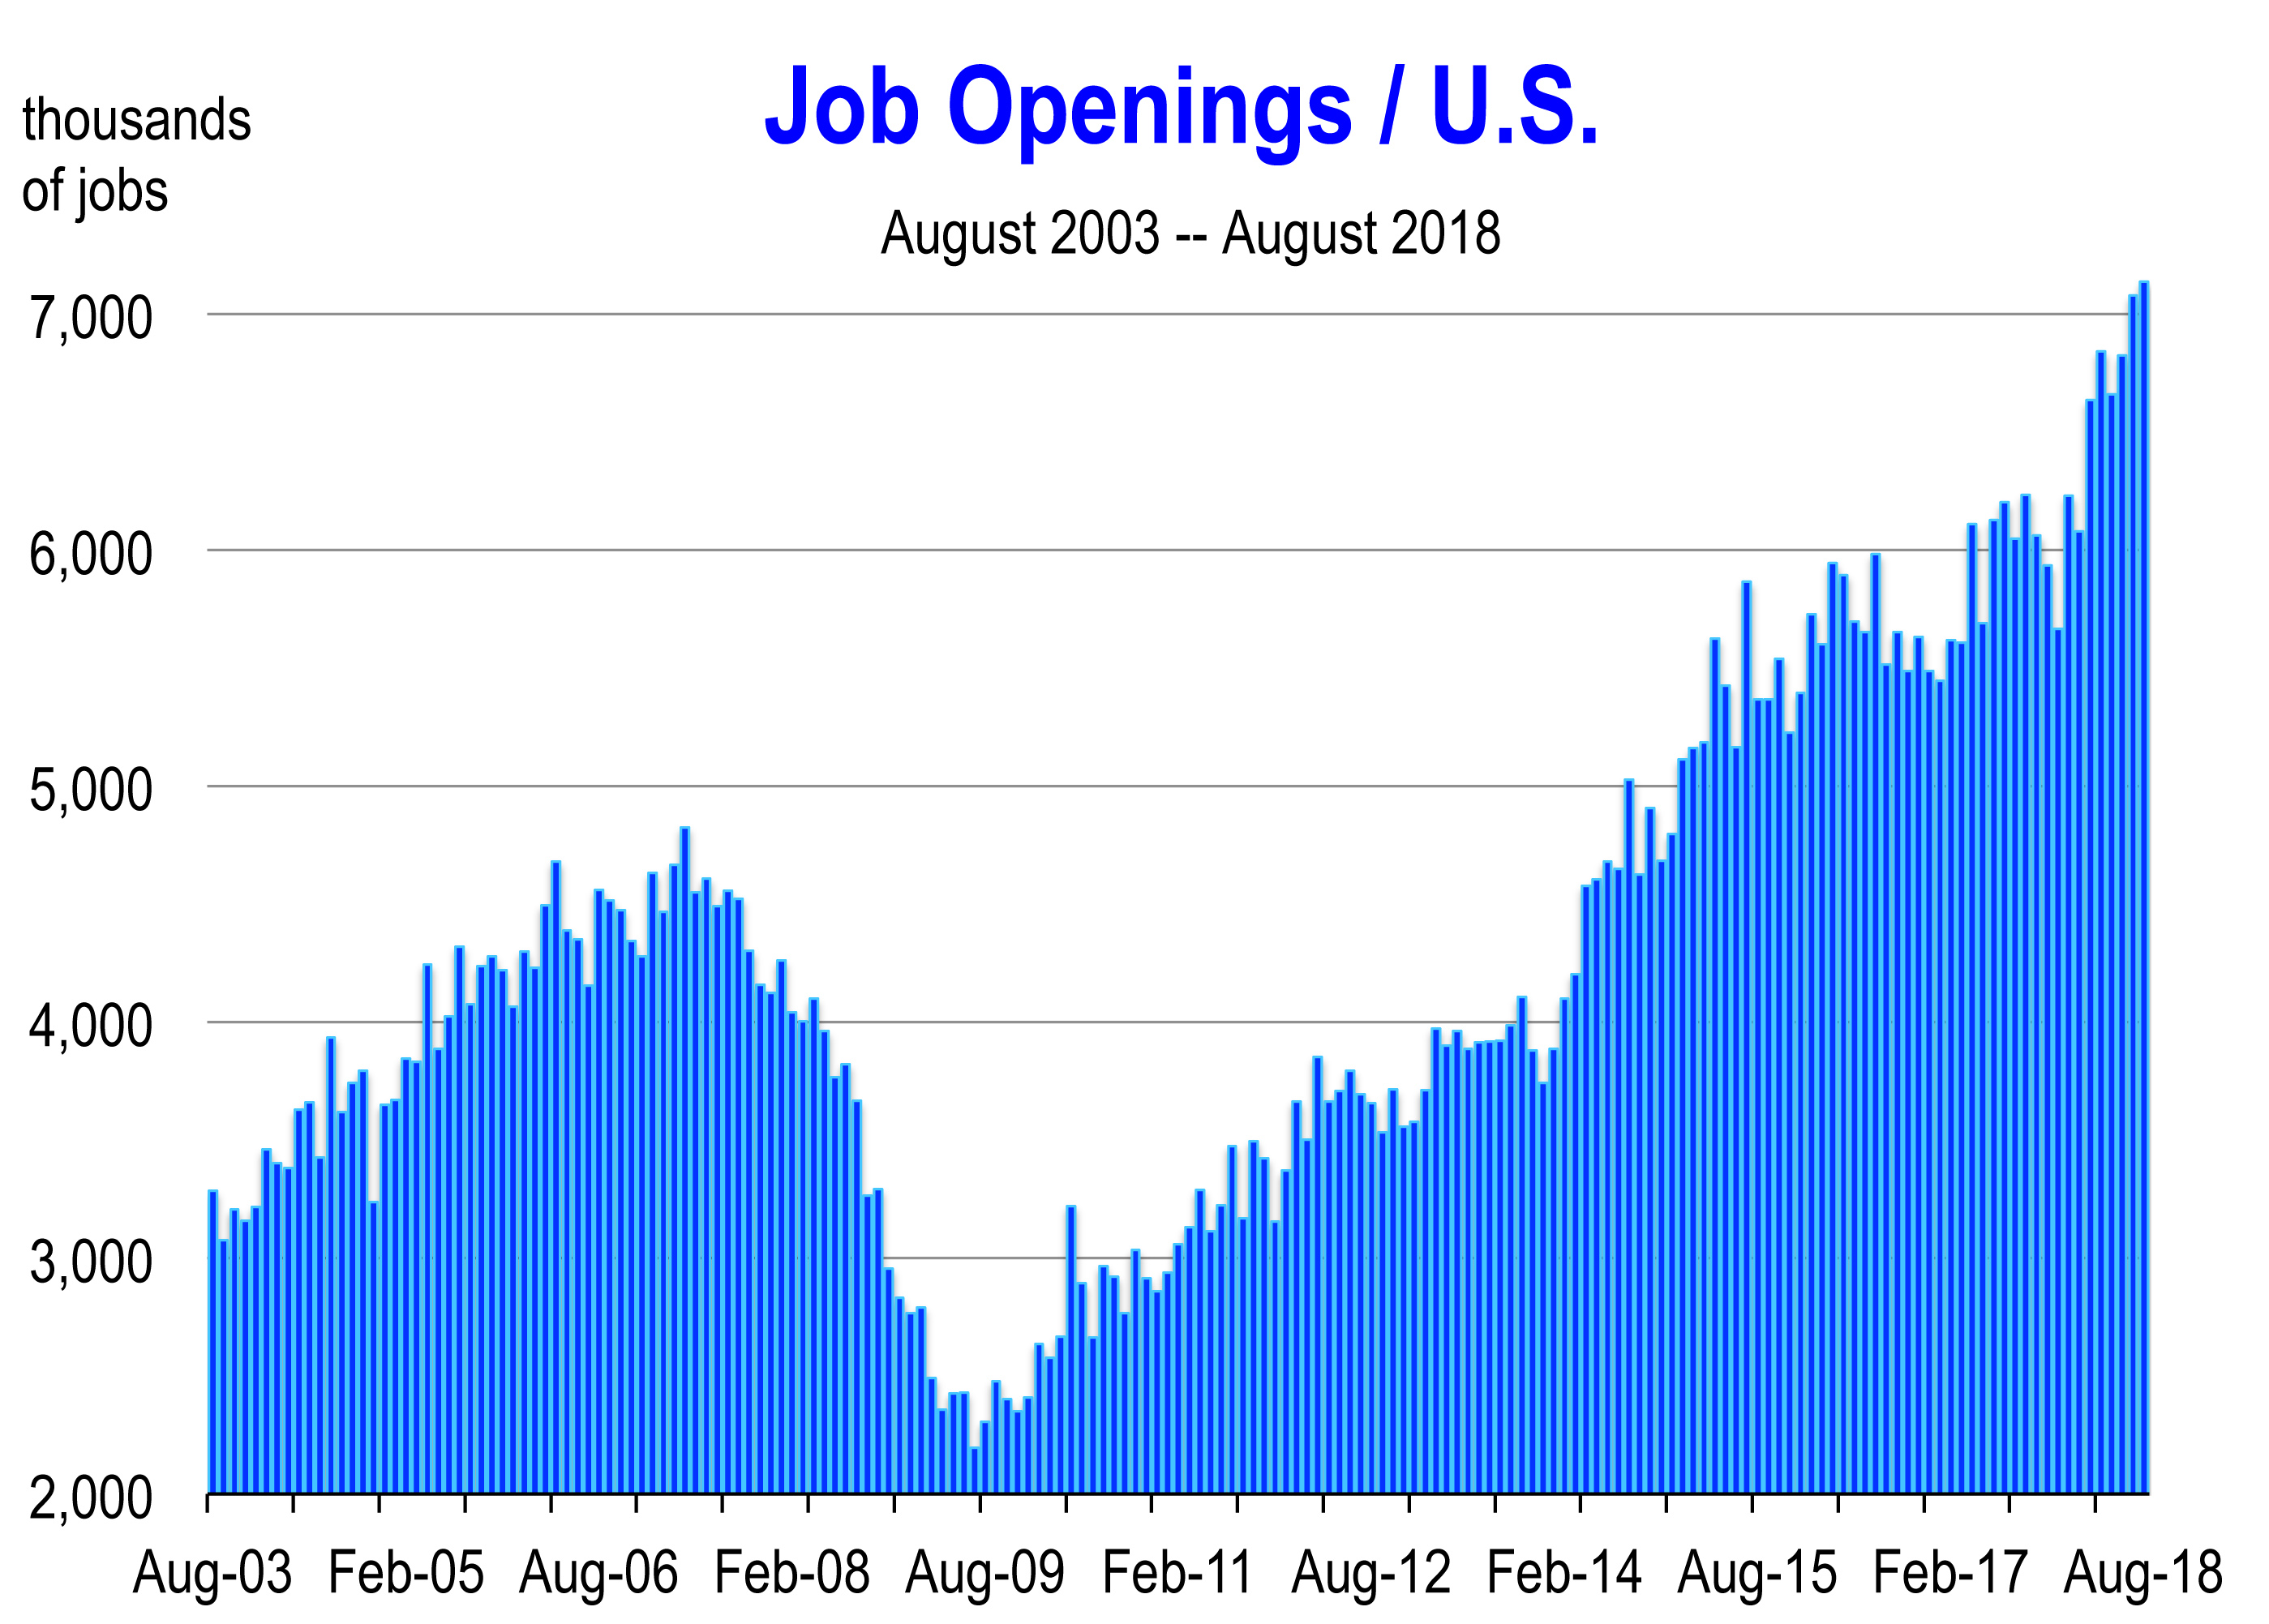
If you want a job you can have one. There are 7 million job openings—18 percent more than a year ago—and more than there are people to fill them. Ironically, this is occurring at a technological time in which many entry level jobs have been eliminated by automation.

4. Wage and salary income growth remains mild despite extraordinarily low jobless rate

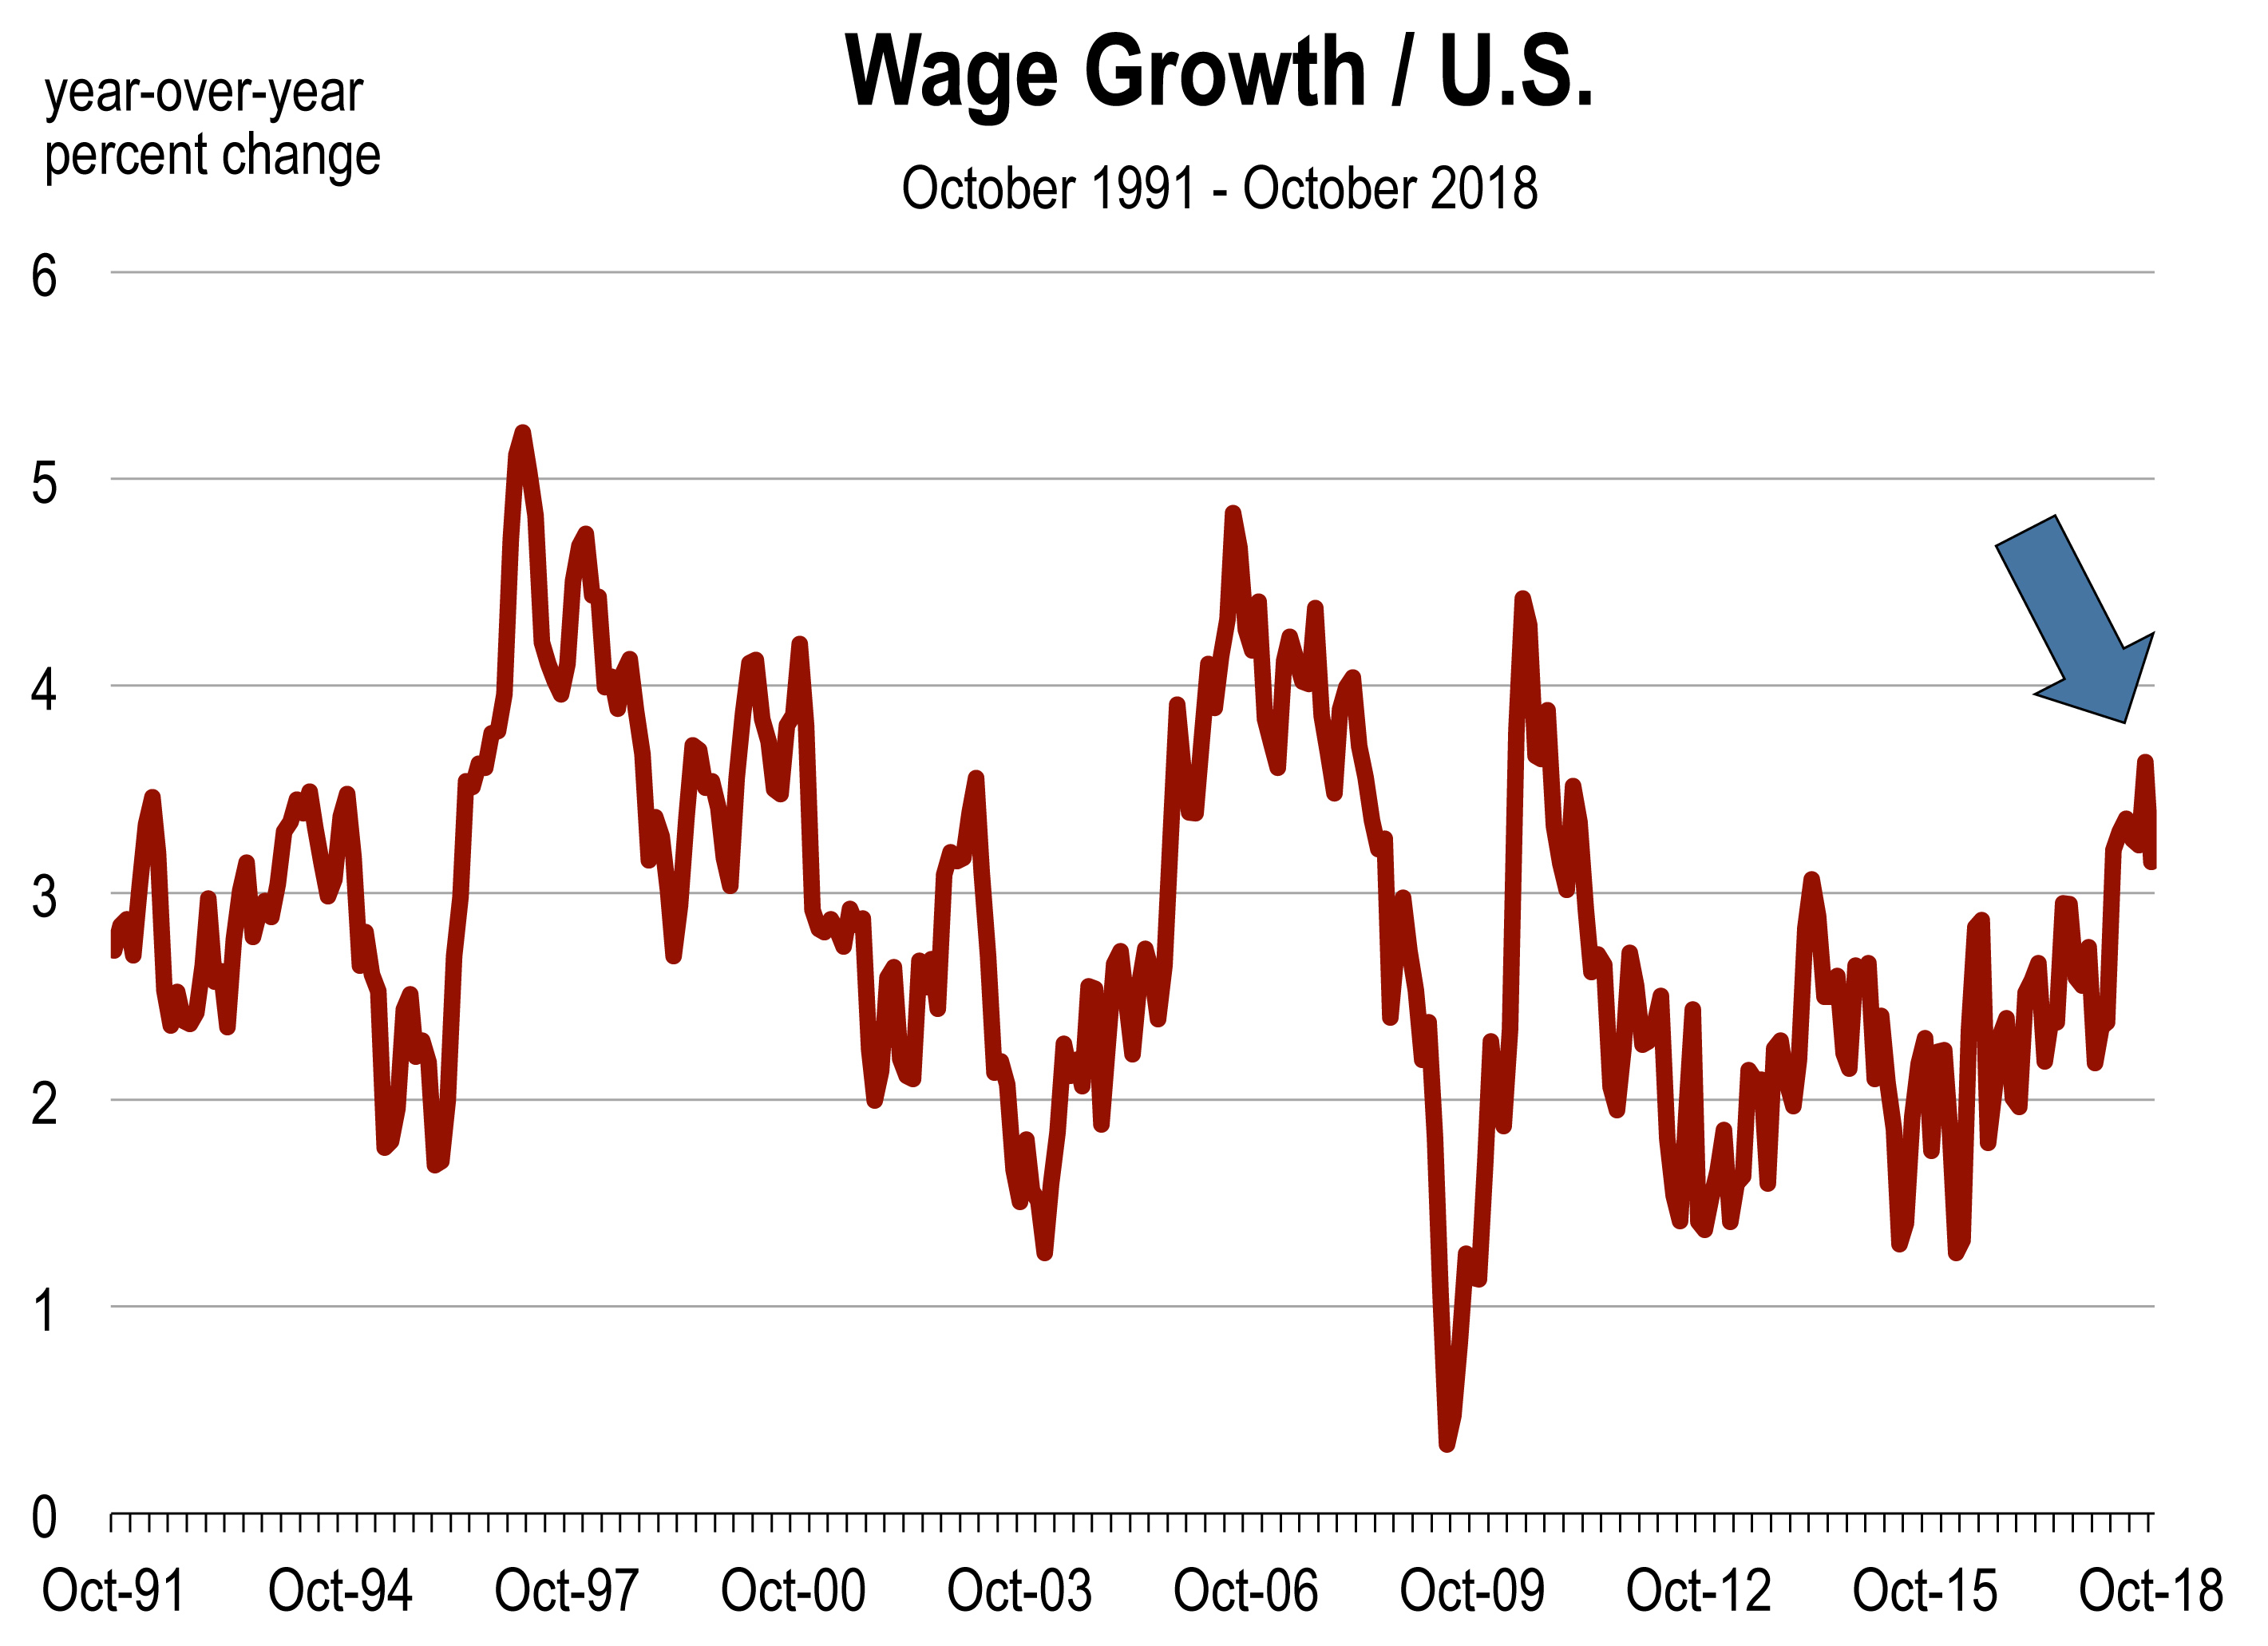
For the 12 months ending in September 2018, the average wage and salary income rose by 3.1% year-over-year. During the 12 months ending in October 2000, when the average unemployment rate dropped to 4%—as it did during the span ending in September 2018—wage and salary income soared by 4.2% annually.

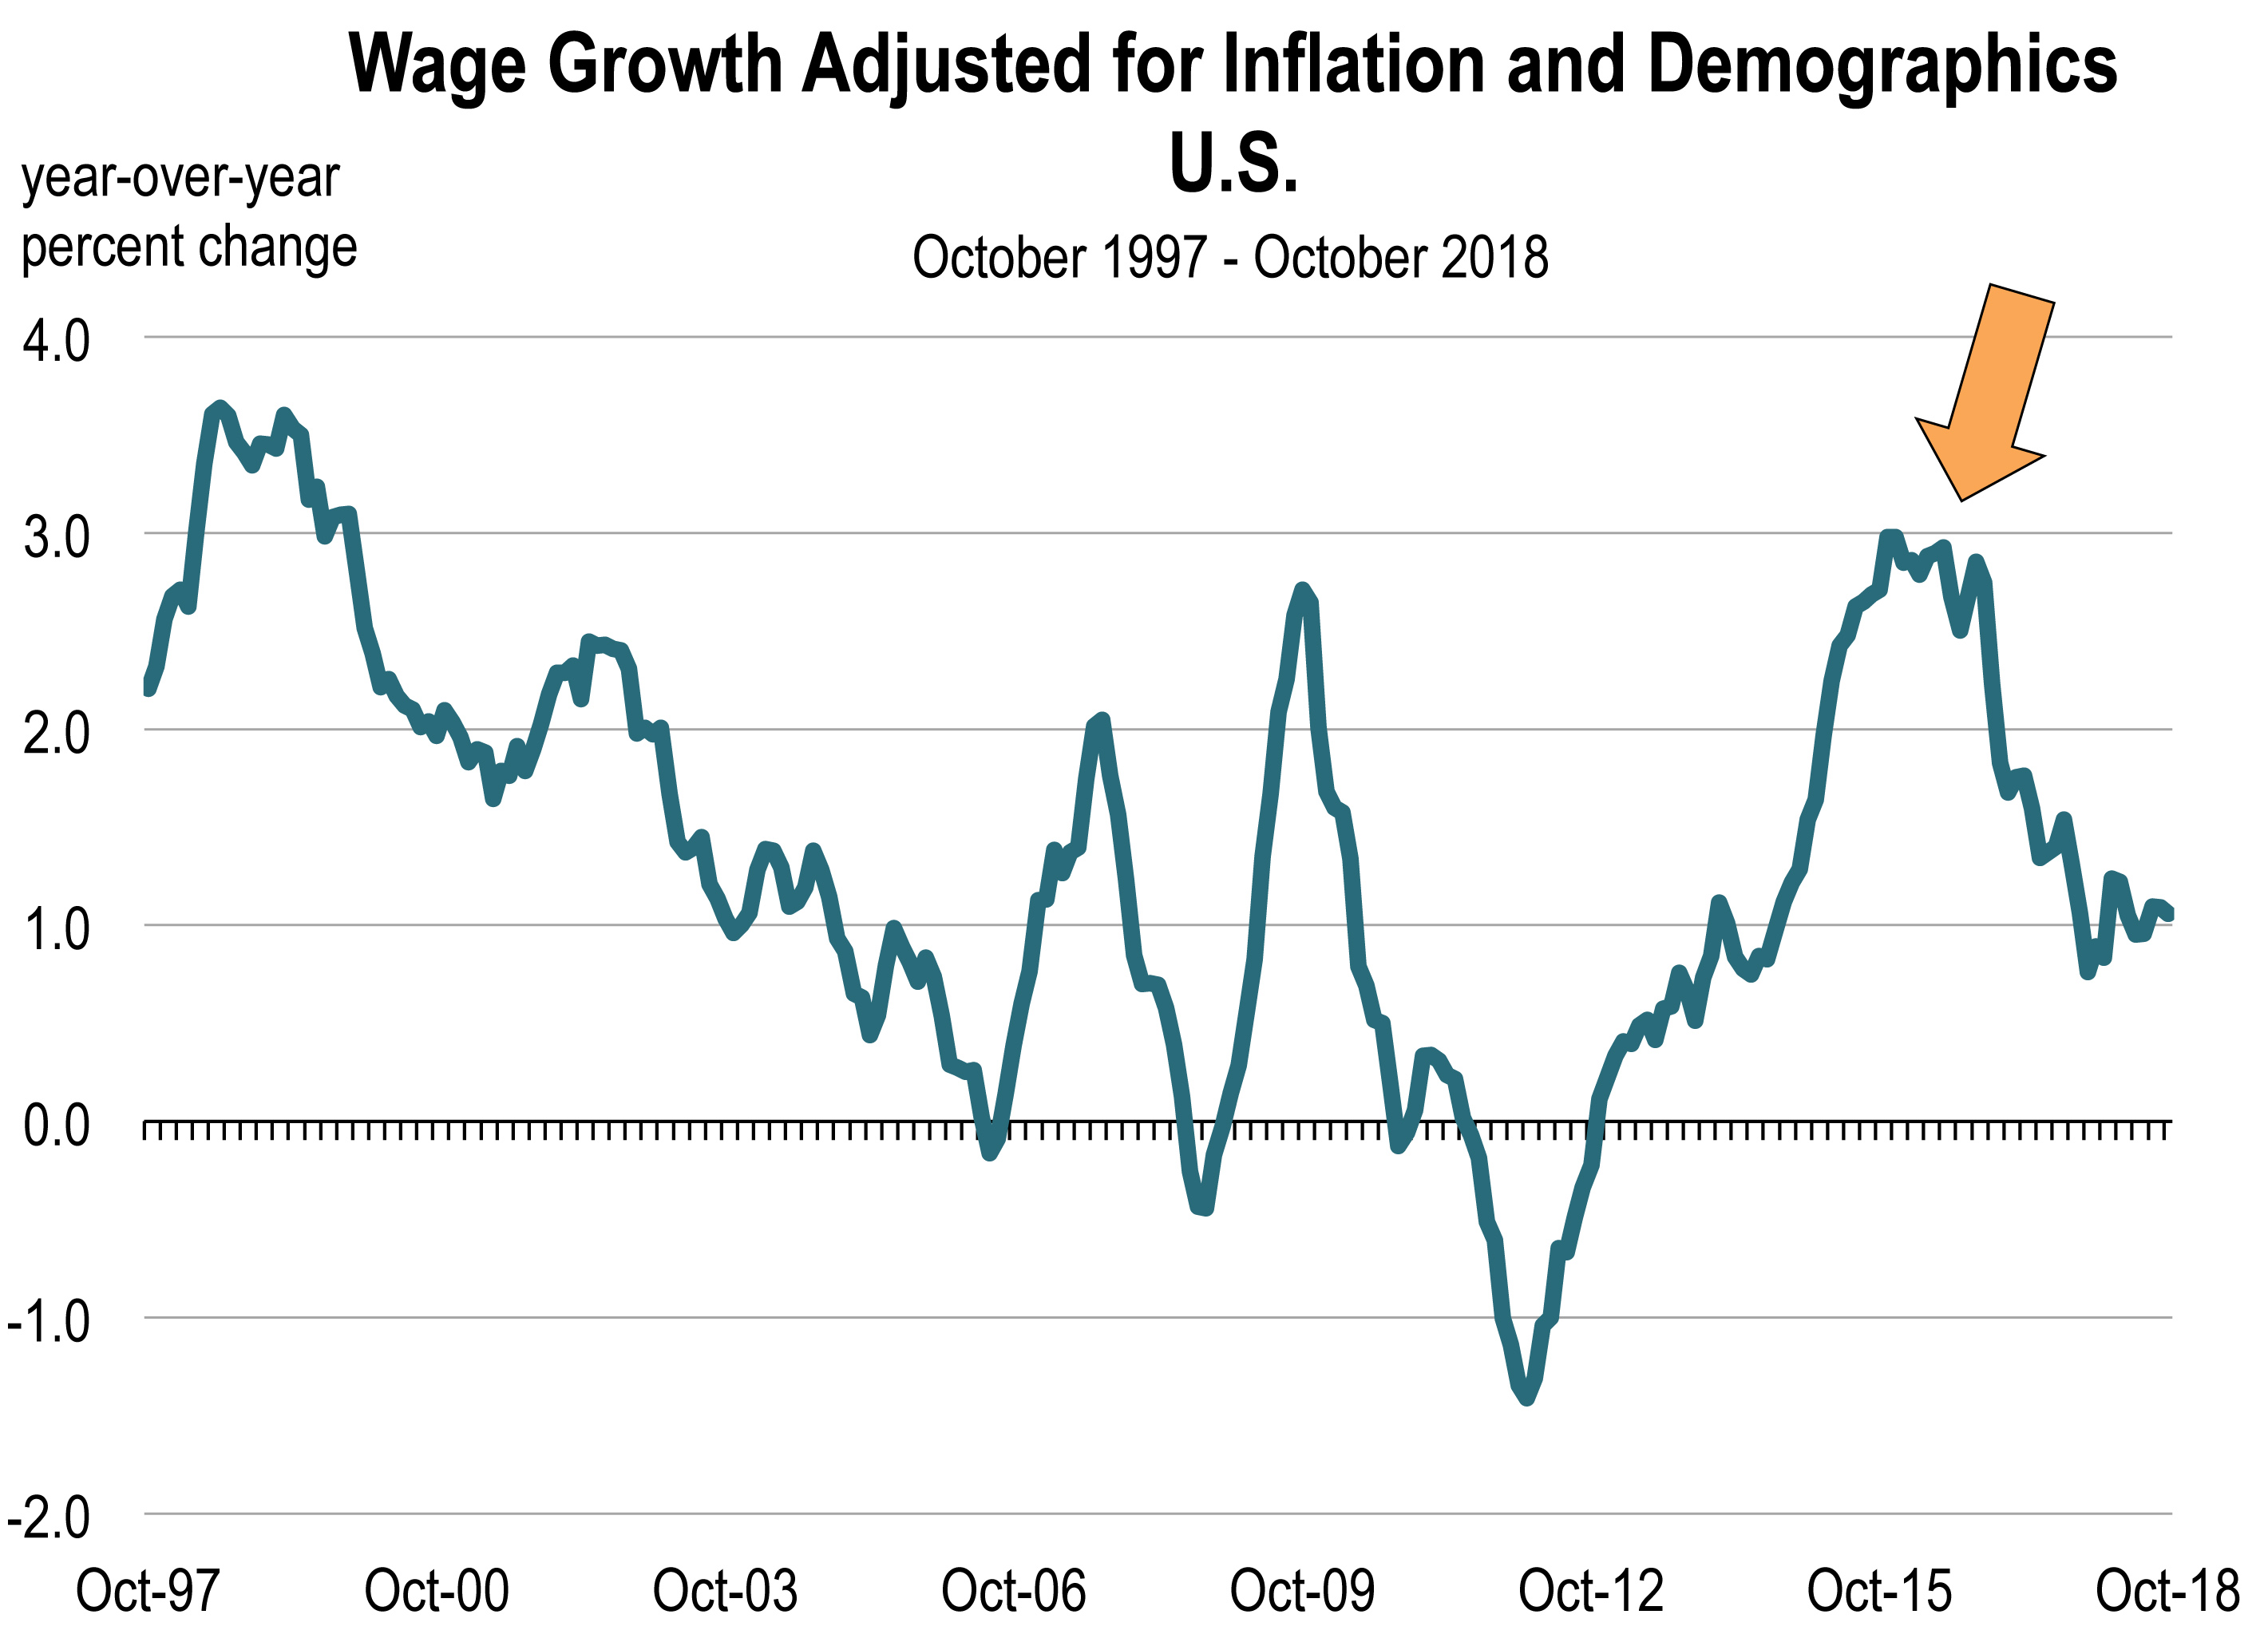
5. However, adjusted for inflation and demographics, wages and salaries are rising nearly as fast as they did during the 1997-1999 expansion, a period often used for comparison

And in California, the growth of wages and salaries during 2018 is the highest in 18 years.

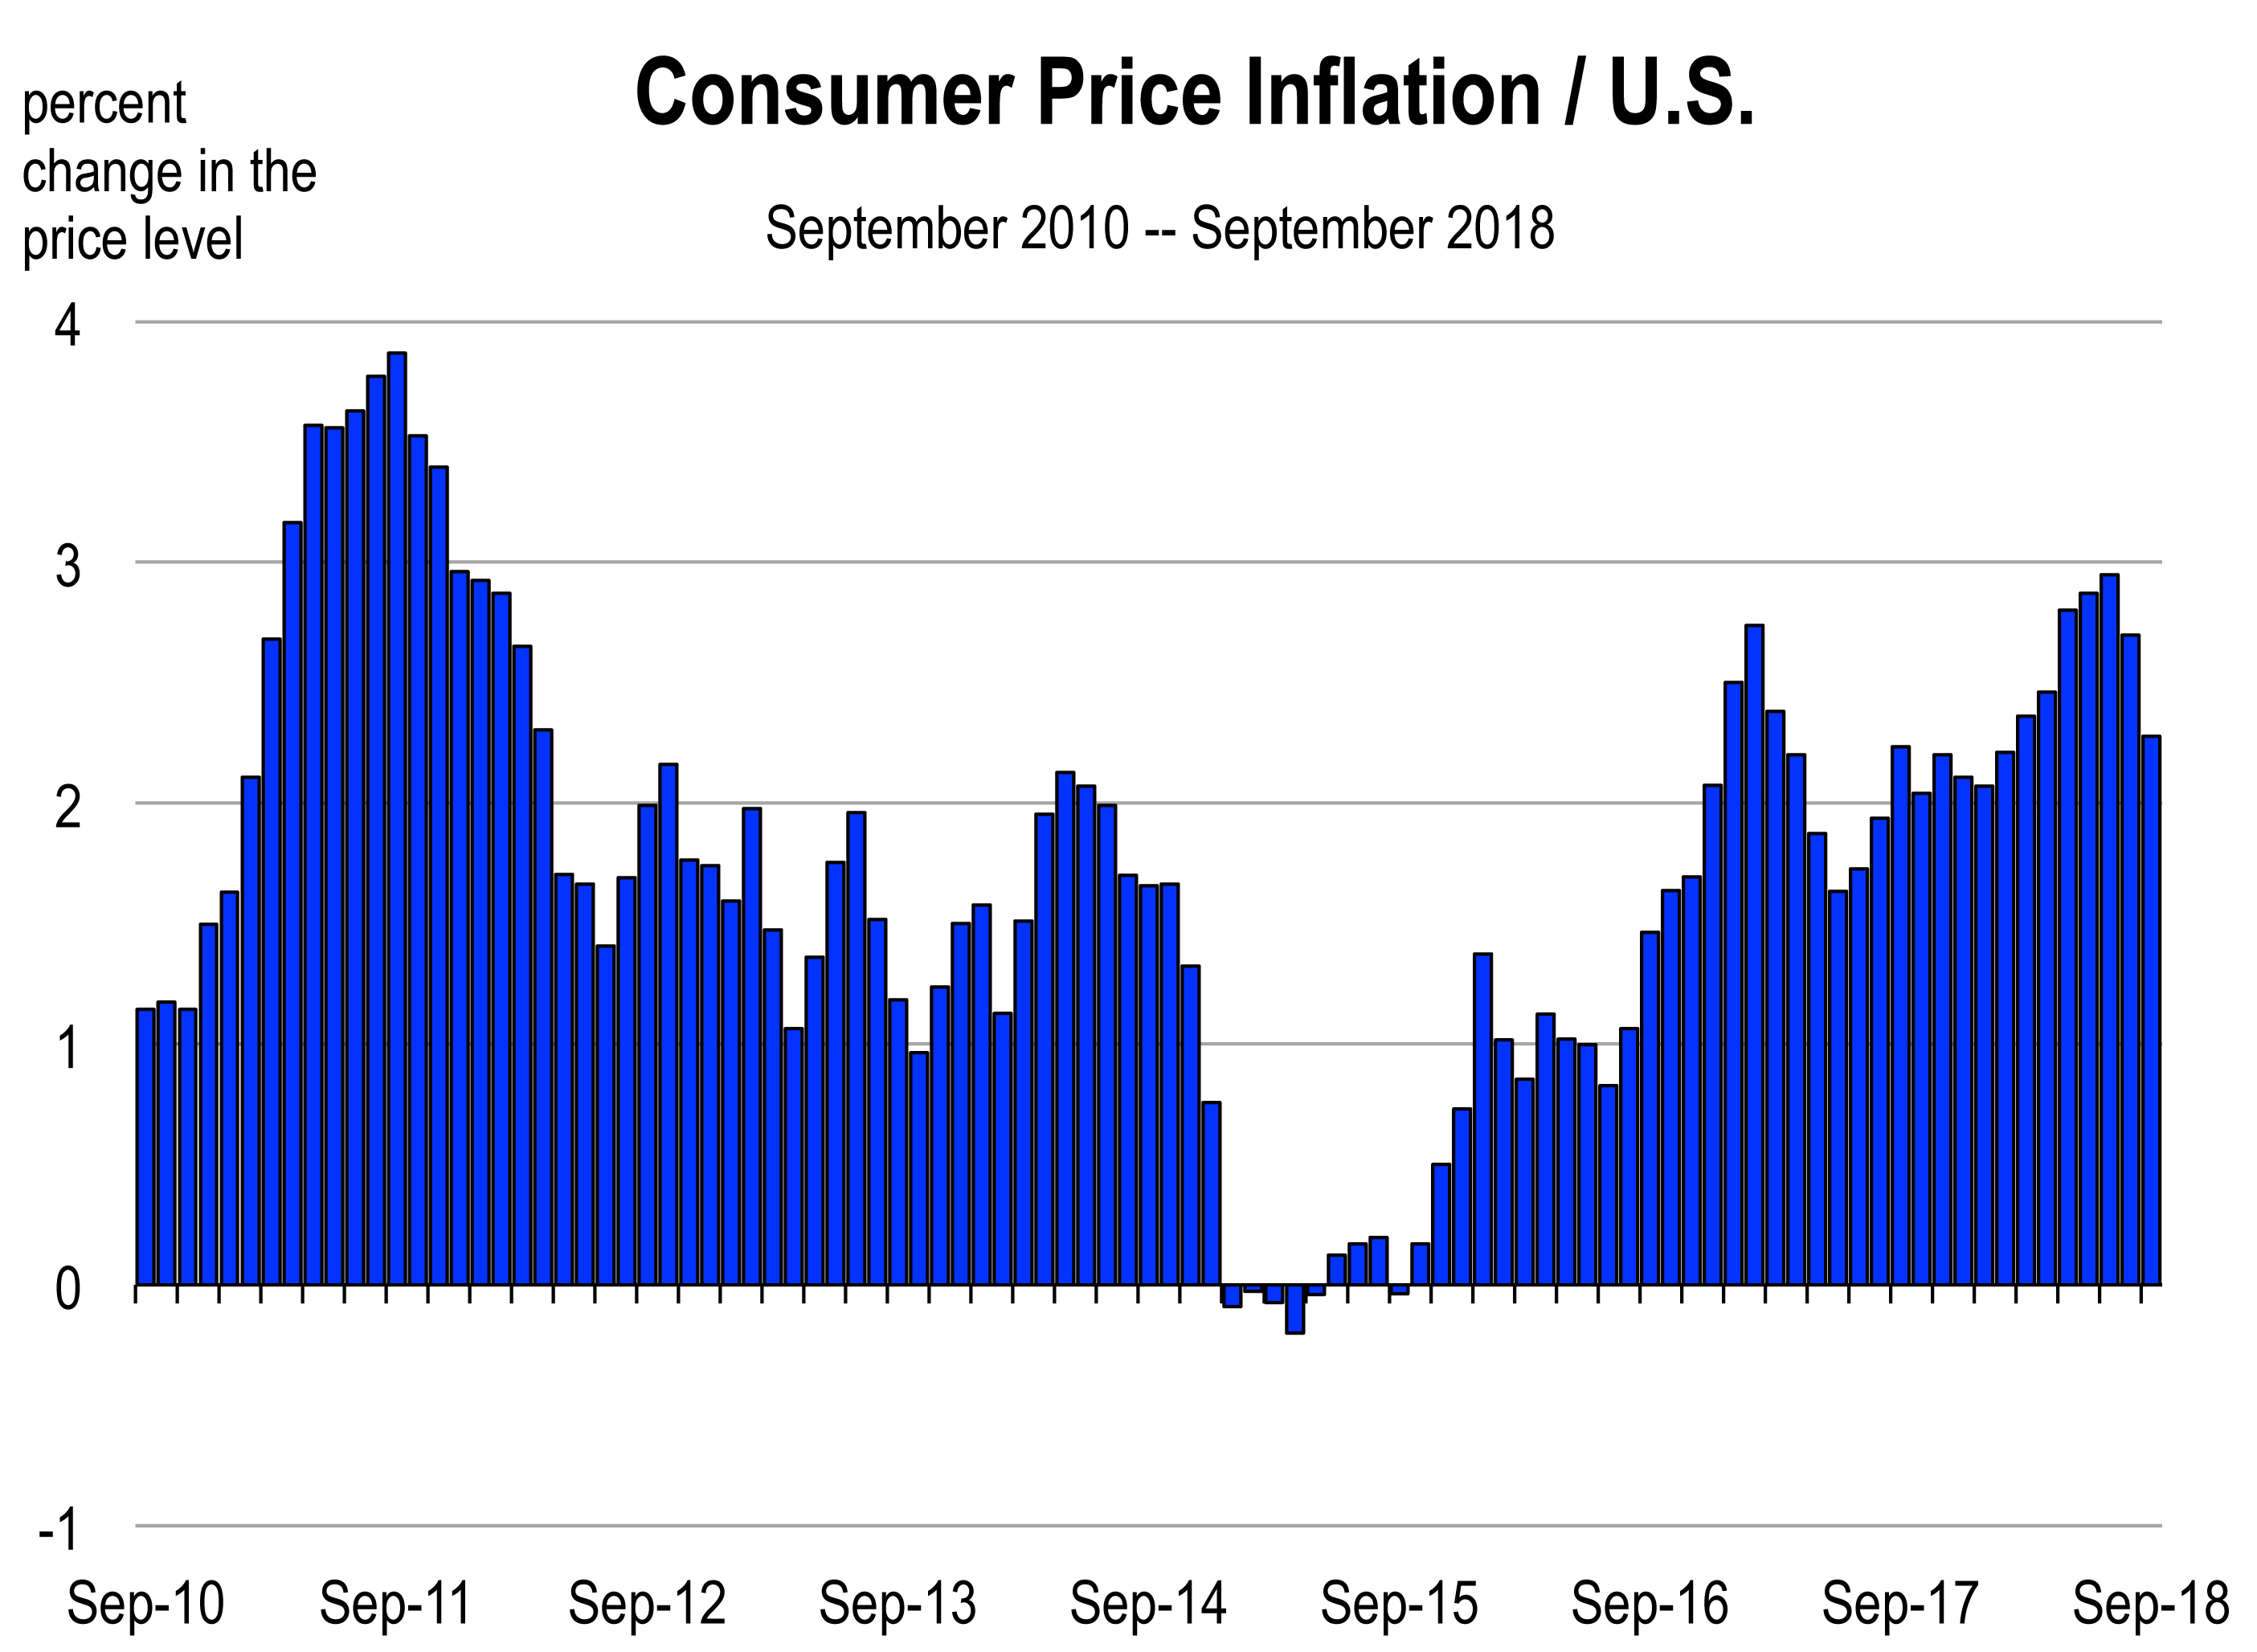
6. Inflation surprisingly remains contained

Despite rising wages, rising home prices, rising rents, and rising construction costs, the general price level has not increased much. There are higher rates of inflation in California but no runaway inflation.

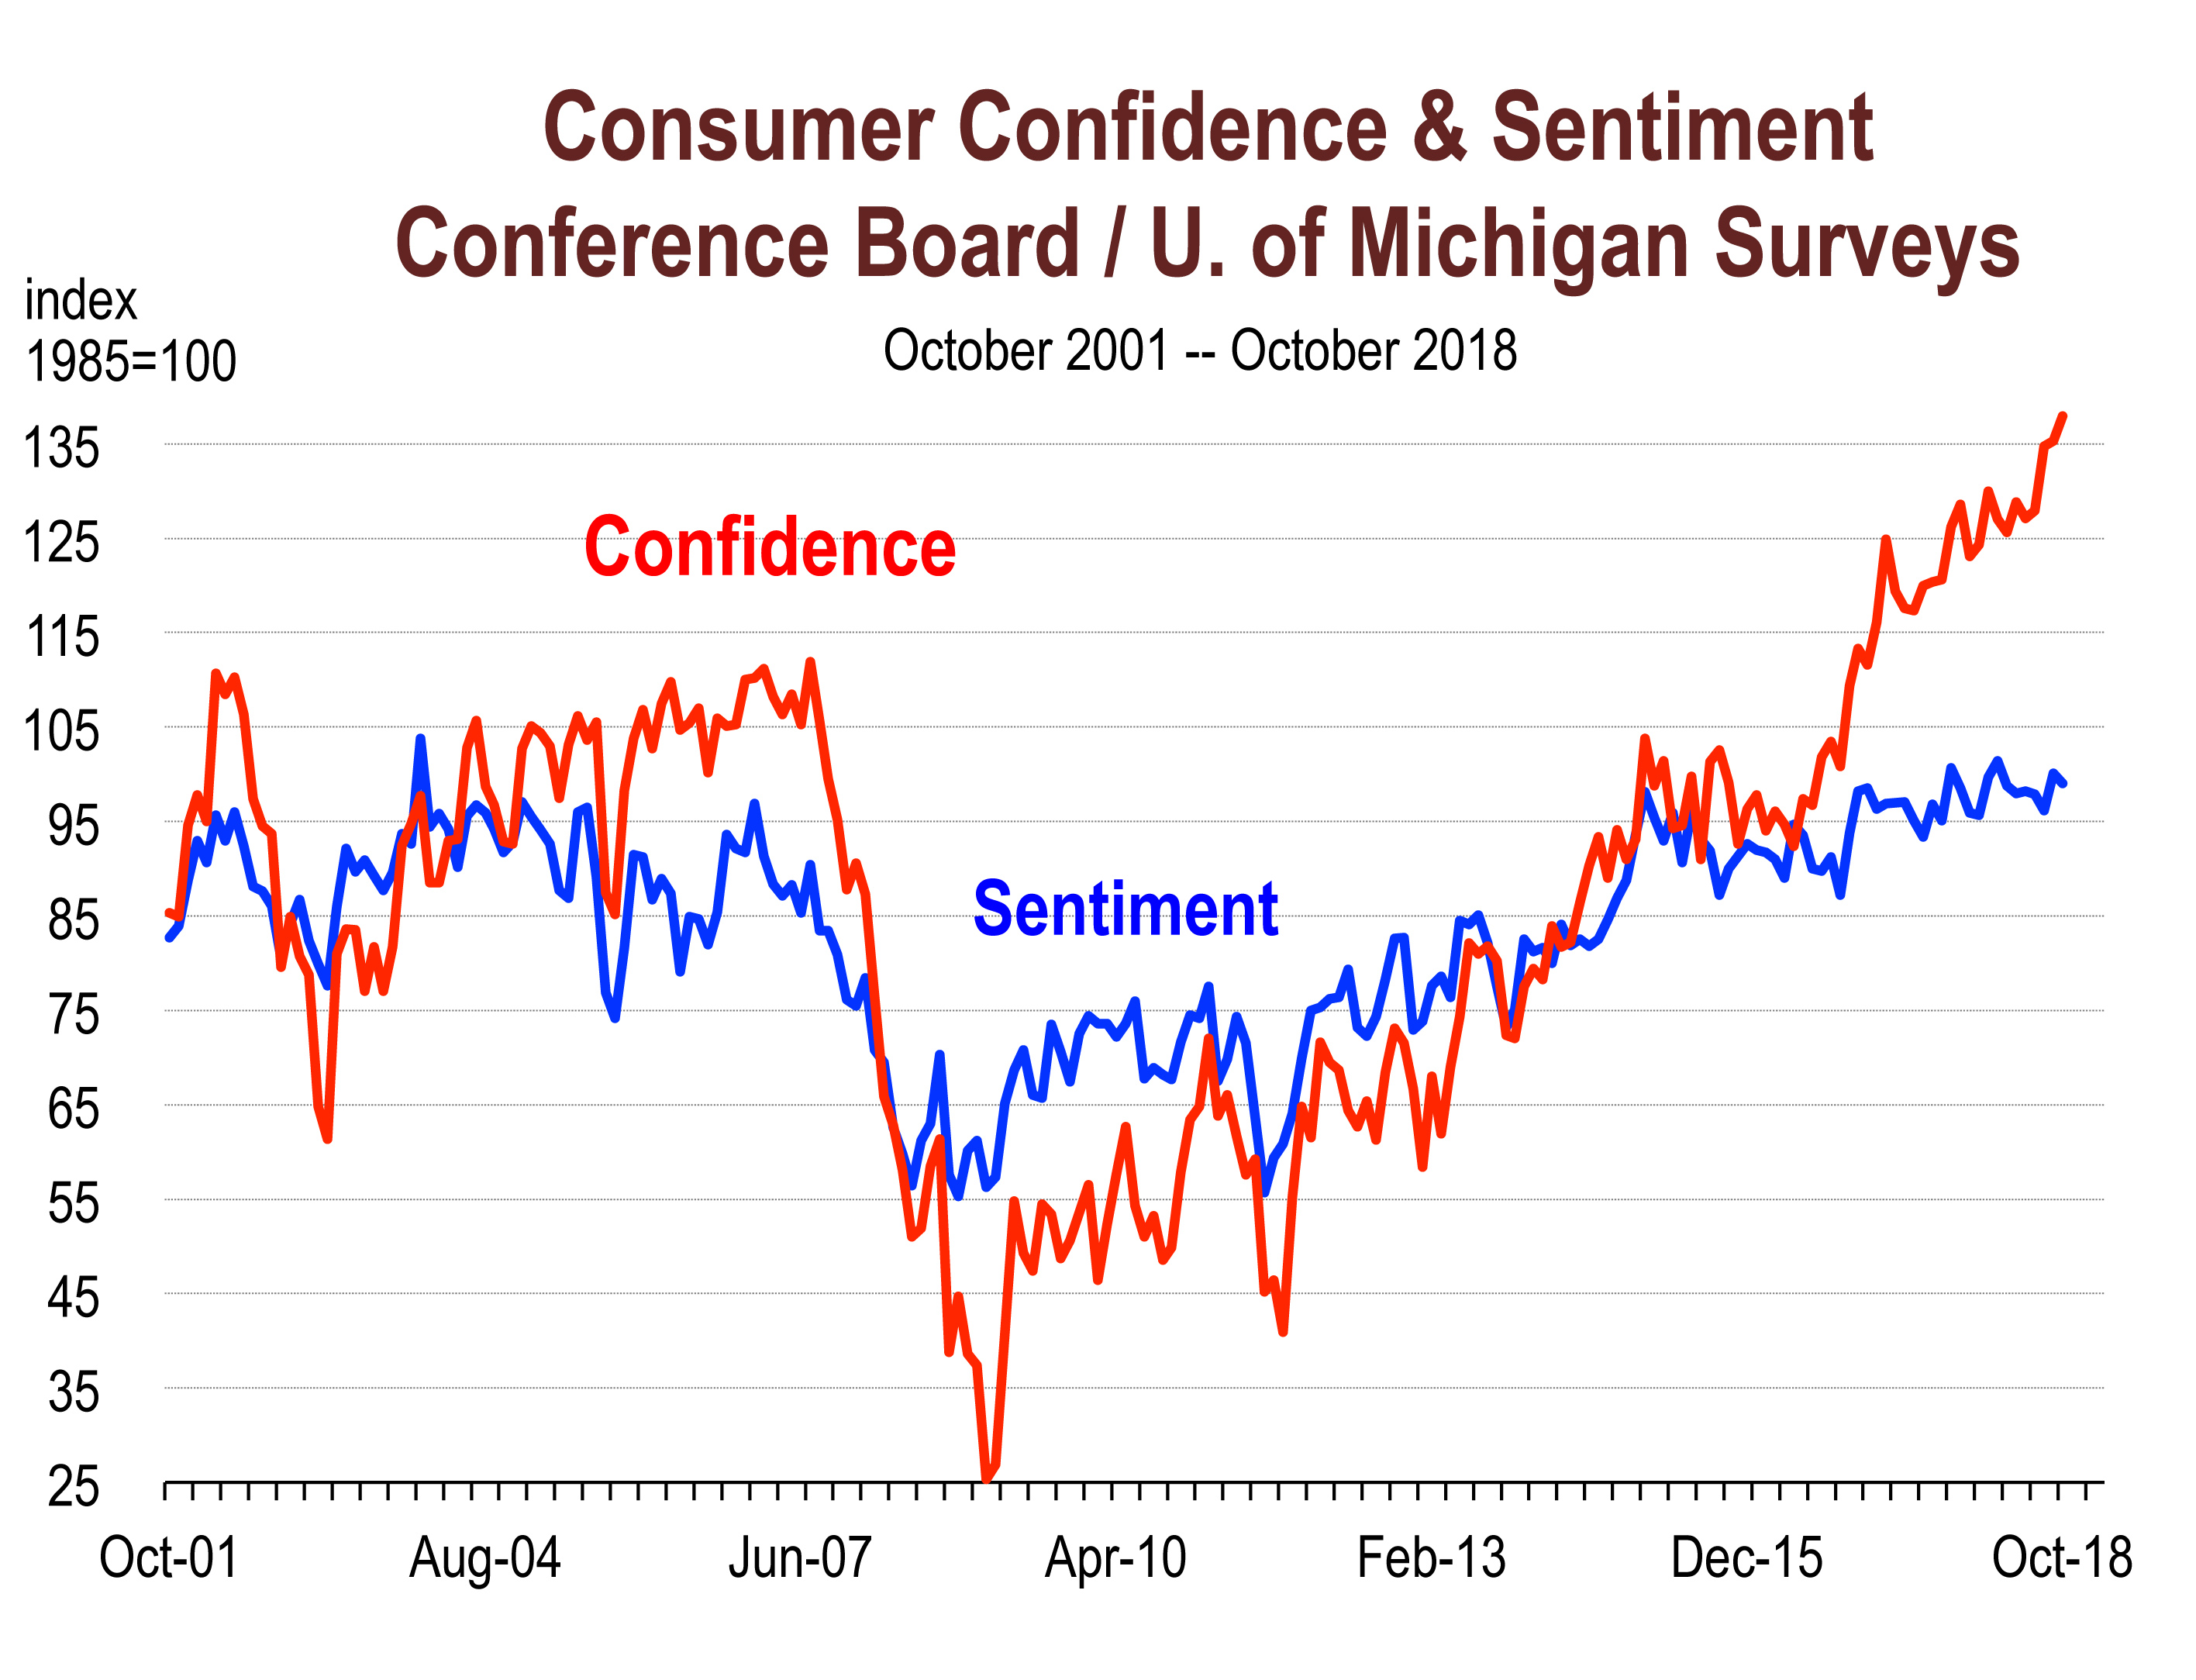
7. Consumer confidence and consumer sentiment are at their highest levels since early 2000

U.S. consumers are still extremely optimistic about current economic conditions and future economic conditions. The index levels for October 2018 are some of the highest ever recorded in a series that began in 1967.

8. The U.S. manufacturing remains surprisingly strong

The ISM manufacturing index, which measures the expansion of manufacturing in the U.S., continues to show surprising strength. The August index rose to its highest level since 1984. September and October were slightly lower but still solid. Furthermore, over the last 15 months, more than 360,000 manufacturing jobs were created, the most for any 15 month period since the mid 1990s.

9. Interest rates are rising and surprising no one

There are no surprises because the Federal Reserve announced long ago their methodical plan to normalize monetary policy and so far, they have stuck firmly to it. Consequently, all federal funds rate increases have been anticipated by investors and this has enabled the financial markets to continue their record breaking journey despite rising rates over the last 2 years.

10. Home prices continue to soar

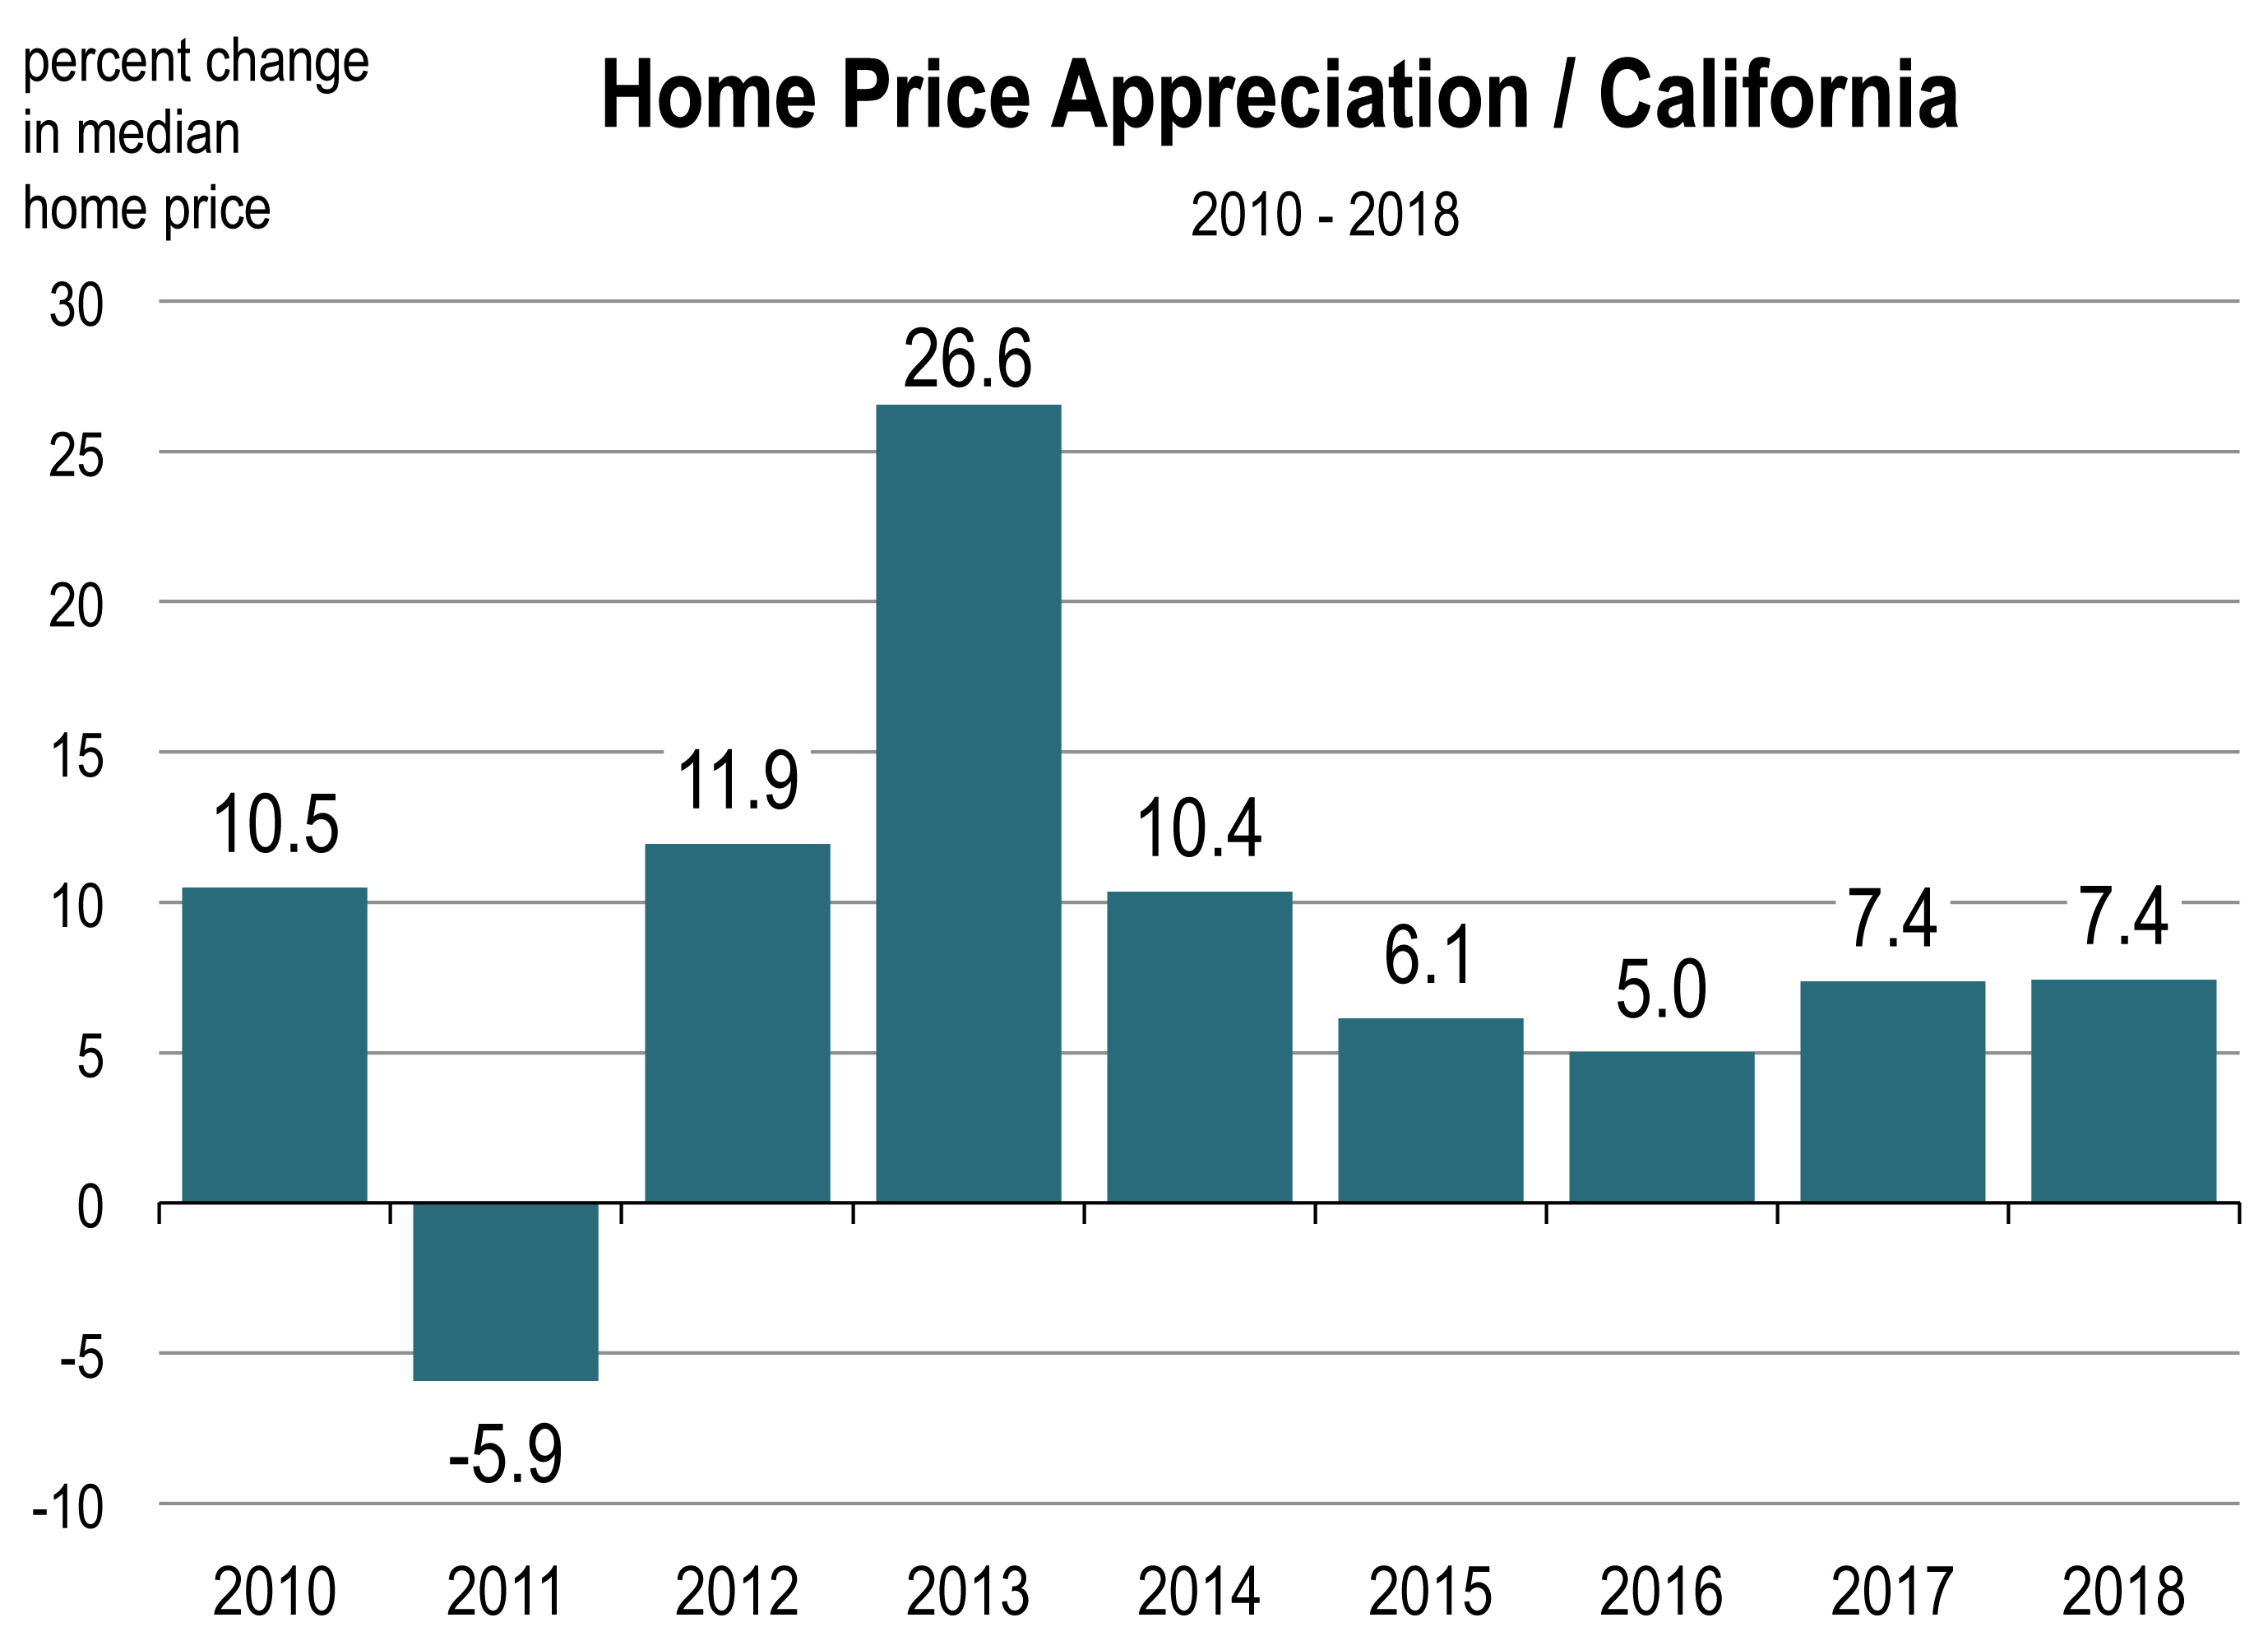
In tandem with the stock market, home prices have been rising continuously for the major part of the expansion. The median selling priced home in most major markets has now eclipsed its previous peak set during the housing bubble days of 2005-2006. This year, so far, home price appreciation in California remains quite strong despite all the claims that the housing market has softened and its days are numbered.


The California Economic Forecast is an economic consulting firm that produces commentary and analysis on the U.S. and California economies. The firm specializes in economic forecasts and economic impact studies, and is available to make timely, compelling, informative and entertaining economic presentations to large or small groups.
Wildfires in California: The New Normal?

by Mark Schniepp
October, 2018

Wildfires and Damage

It’s been a year since the worst fires in the modern history of California swept through Northern California creating a path of unprecedented destruction.

Then there was the Thomas Fire that erupted on December 4, 2017, and the Montecito debris flow a month later.

The Mendocino Complex fire and the Carr fire broke out in late July 2018, and the Delta fire followed in August.

The newsletter this month presents the extent of the damage from these events and raises the possibility that this kind of carnage might be the new norm in California going forward.

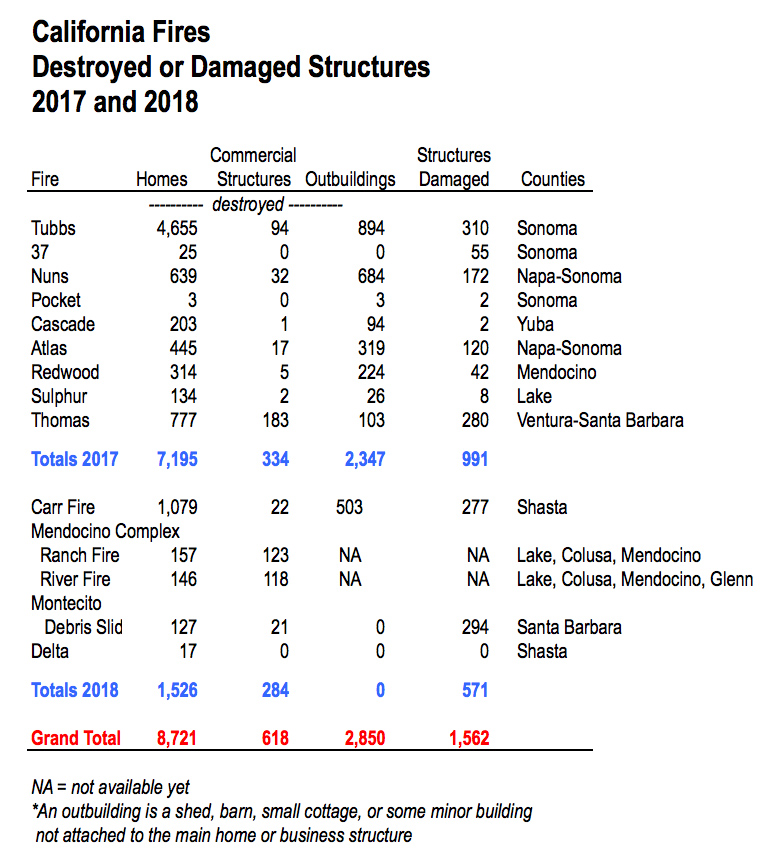
The wildfires that swept through Northern California in October 2017 destroyed more than 8,800 homes, commercial structures, and outbuildings, and damaged another 711.

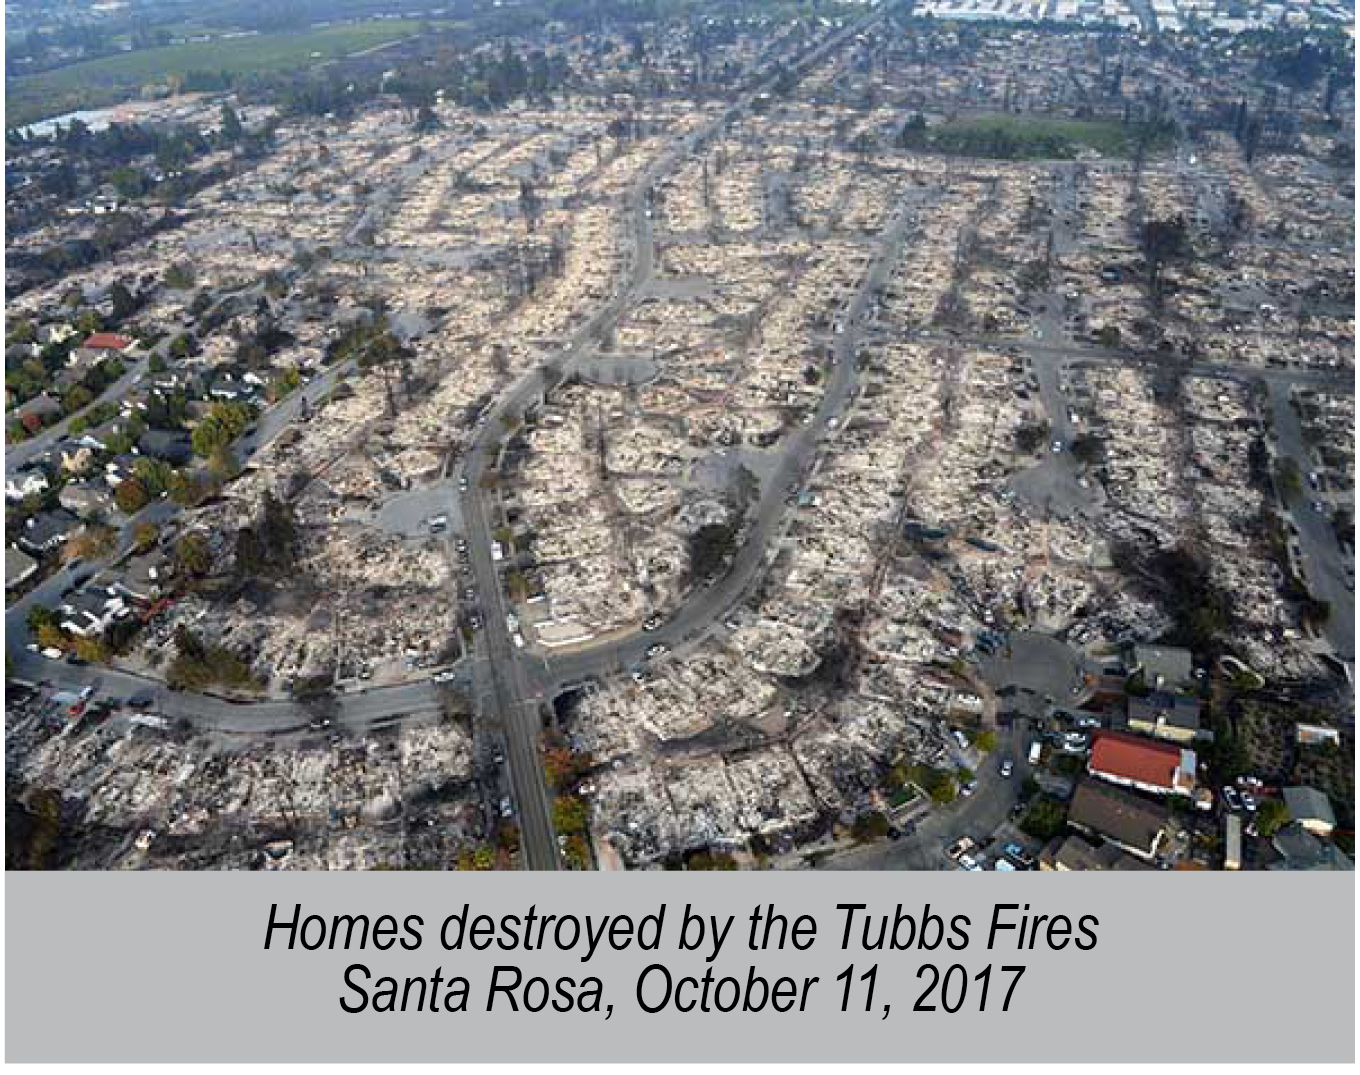
Most of the damage occurred in Sonoma County, which received the brunt of the Tubbs Fire. It started in Calistoga and destroyed portions of Santa Rosa, becoming the most destructive wildfire in modern California history, flattening a total of 5,643 structures. There have been $6.9 billion in insurance claims by nearly 15,000 policy holders of residential properties in Sonoma County alone.

On December 4, 2017, the Thomas fire broke out in Ventura County less than two months after the Wine Country fires. It burned 427 square miles and destroyed 777 homes and 286 other structures, mostly in the City of Ventura.

On January 9, 2018, a freak rainstorm that occurred a week after the Thomas fire was completely extinguished resulted in flash flooding that caused a major debris flow in the Montecito community of Southern Santa Barbara County. The flood destroyed 127 homes and severely damaged another 294 homes. The 220 room 4 Seasons Biltmore Hotel was closed for 5 months. The San Ysidro Inn has yet to re-open.

On July 23, 2018, the Carr fire started in Shasta County. It ultimately burned 230,000 acres and 1,881 structures—mostly homes in the City of Redding—and wasn’t entirely contained until August 30, 2018.

The Mendocino Complex fires erupted in late July of 2018 and were comprised of two wildfires: the River Fire and the Ranch Fire. Further destruction of homes and commercial buildings occurred in Lake, Colusa, and Mendocino Counties. It became the largest recorded fire complex in California history, eclipsing the fire burnt acreage of the Thomas Fire. The Ranch fire was not fully contained until September 18, 2018.

The Mendocino Complex is the largest wildfire in California history, in terms of acreage burned, but remarkably resulted in a lot less destruction to structures than the other fires over the last year.

Altogether, the wildfires destroyed 8,721 homes and damaged 1,562 others. With 10,000 homes needing restoration, this is a major rebuilding effort that will require substantial construction resources, especially construction workers, over the next 3 years.

When we forecast the regional economies located in the fire burned counties, we have to account for the rebuilding effort that will occur within the timeframe of our forecast horizon. Consequently, we are forecasting more new home permits in the Counties of Mendocino, Shasta, Sonoma, Napa, and Ventura and a corresponding increase in construction employment and income in California.

The New Normal?

The state’s six year drought has certainly been a contributing factor to the myriad of fires over the last year. But general climate change is thought to be principally responsible for more fires and greater damage than before by creating ideal conditions for them to burn. Is the state in jeopardy of a rise in the number, intensity, and cost of fires in the future?

Some climatologists suggest that with climate change, wet periods become wetter and dry periods become dryer. So, there is more precipitation in the winter and more growth of vegetation or fuel for future fires. Then, warmer and drier conditions during the spring, summer, and fall increase the chances of fires starting and also encourage them to spread.

Therefore, we need to seriously reconsider the building of more homes and other structures in fire prone areas. A study in March 2018 published in the Proceedings of the National Academy of Sciences found that where houses and wildland vegetation meet or intermingle, wildfire problems are most pronounced. And that between 1990 and 2010, nearly 13 million homes were built in these areas in the U.S.

A change in perception about where we are building may be necessary if climate change is truly responsible for the increase and extent of wildfires in California. Building in denser urban locations for housing rather than peripheral areas adjacent to forests or rangelands should be encouraged rather than discouraged to avoid both human tragedy and the heightened destruction of homes and businesses from fire. Rangelands and forest exist in all counties throughout the state.

As it is, we are not building enough housing so adding further restrictions on location will be highly controversial. But it may be necessary in view of the increased risk of fire, the soaring cost of fighting fires, and the structural damage that results from their number and intensity.

The California Economic Forecast is an economic consulting firm that produces commentary and analysis on the U.S. and California economies. The firm specializes in economic forecasts and economic impact studies, and is available to make timely, compelling, informative and entertaining economic presentations to large or small groups.
Subtle Changes

by Mark Schniepp
September 2018

The Seasons Are Changing

It’s fall. School started again. My kids began their junior year in high school. Though they didn’t say anything about it and would certainly never admit it, I think they were glad at the change in their daily schedules that 6 hours of school brings. After all, school also brings their friends together, sports, and social events.

And parents’ schedules often change to accommodate school. You have to drive kids to school, to sports, and to the events. You have to make time to attend some of the school functions. You might even be asked to solve a homework problem or two, or help with a school project.

It’s getting darker in the morning, so I have to turn the lights on when I get up. I also have to shut the windows (halfway) because I’m noticing falling temperatures in the early morning hours and slightly cooler days. My cilantro was bolting like crazy in July, but now I can grow it again. There is change with seasons.

And what about the economy? Though some subtle changes are occurring, for the most part, there’s a lot less change than what’s happening with school starting, temperatures falling, fewer hours of sunlight, and my cilantro garden.

Tariffs Are Here

They represent a change, but how big a change?

Following the round of tariffs in the spring, another wave of tariffs was implemented last week, this time on $16 billion worth of Chinese goods imports. China has retaliated in kind, with 25 percent tariff rates on $16 billion worth of U.S. goods imports, targeting chemical and fossil fuel industries.

The latest wave of tariffs has imposed duties on $100 billion worth of goods imports. However, this represents only about 4 percent of total imports, so it’s not that significant of a change.

Some protected industries may benefit from higher tariffs on foreign competitors, but businesses that rely on foreign imports, such as retailers and finished goods manufacturers, will face higher input costs, and U.S. consumers will face higher prices. Protectionist trade policies have also resulted in retaliation by some principal trade partners but the extent of that retaliation has not been very significant.

Though we haven’t seen much yet, trade-related uncertainty is likely to weigh on business confidence and investment, while an escalation of tariff activity has the potential to slow down consumer spending if import prices rise. However, recent negotiations with Mexico over NAFTA, which have resulted in a new agreement, and the resumption of talks with China could signal an appeasement of tensions in coming months.

To reiterate, there is little to any indication that new tariffs have impacted the economy. Manufacturing continues to grow, exceeding expectations, as is consumer spending, and the value of exports is still rising together with imports.

Inflation and Interest Rates

Both are rising, but gradually.

A tighter labor market, stronger wage growth and the tax cuts have provided a big boost to spending, especially at restaurants and clothing stores. Retail sales growth has surged over the last several months, and consumers continue to be a strong engine of growth for the economy.

The acceleration in spending together with a fully employed economy incentivizes the Fed to continue normalizing interest rates, and this month rates will go up again, likely by another quarter point.

GDP Growth

Above trend performance.

Second quarter 2018 growth was revised upward to 4.2 percent, and third quarter GDP is tracking at between 3.5 and 4.0 percent growth. These values are a change to the upside and represent some of the fastest growth observed during the current expansion.

The economy keeps firing on all cylinders domestically and the implications for GDP growth are positive. The consensus forecast has the economy on track for above-trend performance this year and during the first quarter of 2019.

What’s Not Changing?

Fed interest rate policy. The Fed was expected to raise rates gradually in 2016, 2017 and 2018 and that’s exactly what has happened. Investors have not been ambushed and are pleased with predictable interest rate conditions. Consequently, long interest rates have only moved slightly higher over the last 18 months, the stock market is moving upward again, and there has been no slowing impact on growth.

General economic conditions. Basically, the economy hasn’t changed much, despite entering into the 10th year of the current expansion in July. Another 10 months and the 2009-2019 economic expansion will be the longest in recorded history. By now, economists thought a slowdown would have occurred along with a faster pace of inflation, higher treasury bond yields, a stock market correction, and a hiccup in international trade flows. None of this is here yet.

Both consumers and businesses still feel very good about today’s economy. And they should be with the value of output rising, wages and salaries rising, the stock market near all time highs, and labor markets fully utilized. Furthermore, the likelihood of recession remains very low and is, in fact, declining again.

Now is not the time to worry yet. Enjoy the fall.

———————

The California Economic Forecast is an economic consulting firm that produces commentary and analysis on the U.S. and California economies. The firm specializes in economic forecasts and economic impact studies, and is available to make timely, compelling, informative and entertaining economic presentations to large or small groups.

Shortages

by Mark Schniepp
August 2018


Three Come to my Attention

  1. Workers
  2. Housing, and
  3. Water

In fact, we have escalated the “housing shortage” into a “housing crisis.” Soon, and we might already be there, we will have a “worker” crisis. Despite the end to the drought in Northern California, we still refer to the issue of water as the water shortage here in Southern California.

Why Do We Call it a Shortage?

In the case of workers, the unemployment rate has declined to 3.9 percent nation-wide, and 4.2 percent in California, both at their lowest levels in a generation or more. In Los Angeles, the unemployment rate has now fallen to the lowest level in 50 years. Workers are tough to recruit, both skilled and unskilled. Often times employers have to offer a lot more pay for the same position or accept lower or un-skilled candidates for that job, or both.

In the case of housing, the current pace of demand is faster than the pace of supply, and this is causing ever increasing prices for rental and purchase housing. Inventory levels of for-sale housing are at 10 year lows. Apartment vacancy rates are extremely tight everywhere you go and in many areas are at record lows.

In the case of water, water purveyors and cities have called for extreme conservation measures to reduce water use. No lawn watering during the day (or at all), shorter shower times, low flow faucets, elimination of gardens, etc. Many municipalities have increased water rates to pay for higher cost water systems or to finance water banking or storage.

Is it Really a Shortage?

No.

In a capitalistic and competitive economy, there are no shortages. Markets “clear,” meaning that the price is the allocating factor when there “appears” to be a shortage. People generally proclaim a shortage when the price rises sharply or beyond traditional or affordable levels.

A true shortage would occur if the price was fixed and demand was greater than supply. Then people who wanted the good would only be able to get it by some other allocation method other than price, such as by lottery or having to wait in a queue for more of the good once it was produced. Price would not be an allocating factor but you standing in line would be. Or you successfully bribing the distributor of the good to provide it to you for an amount above the fixed price.

So a shortage only occurs when you cannot obtain the good or service when you need it or want it (and you are willing to legitimately pay more for it), allowing perhaps for some transitional time for errors in inventory or delivery lags or whatever.

If it’s not a Shortage, Then What is It?

It’s called market clearing: the forces of supply and demand and the end result: price appreciation. That is how capitalistic economies allocate scarce resources. Right now, housing is scarce in California, labor is scarce all over the nation, and water is particularly scarce in Southern California.

How do we eliminate scarcity? We allow the price to rise and allocate goods through the price system. If you have $1 million, you really don’t face a housing shortage. You can buy a home in most markets of the state for that amount, except perhaps the Bay Area, Santa Barbara and particular areas of Orange and Los Angeles Counties. But in general, a million dollars will buy you a house with little delay, today.

If you need to fill a position in your office, you can probably get it filled right away if you are willing to offer a higher salary than your competitors, more benefits, or both. There will likely be no shortage of candidates for the job.

If your budget does not allow for offering more salary or for spending more for housing, then you need a Plan B. Having to accept Plan B has you thinking “shortage,” because as we all know, Plan B is seldom preferable to Plan A and may test your maximum willingness to pay.

What Can We do About “Shortages?”

Or what can we do about demand becoming excessively greater than supply and prices rising sharply beyond our affordability levels?

Produce more of the good, which is the response of supply to excessive demand. In the case of housing, we probably can’t do that in California because of so many constraints including land, CEQA, nimbyism, and policies (or laws) that restrict building, density or both.

So we are left with high prices and rents for housing and it’s likely to stay that way unless the growth of demand slows down, stops, or reverses. This might happen during the next recession like it did during the last one.

“Labor shortages” are always cyclical and are therefore always temporary. The “shortage” of workers will end when the economy slows down or contracts, or technological advancements are able to substitute many robotic or automated processes for human driven activities today. This may happen sooner than you think and we may be talking about a surplus of labor instead of shortages.

And in the case of water…. well that’s easy. A decent rainy and snowy year or two will dash any drought and enable us to water our lawns again.

———————

The California Economic Forecast is an economic consulting firm that produces commentary and analysis on the U.S. and California economies. The firm specializes in economic forecasts and economic impact studies, and is available to make timely, compelling, informative and entertaining economic presentations to large or small groups.


Student Loan Debt: How Serious is it and Where Will it Lead? (Part 2)

by Mark Schniepp
July 2018

Is the Student Loan Debacle a Bubble, and will it Burst?

In a word, and despite what Mark Cuban says: No.

However, student loan debt is still a problem due entirely to its enormity. It’s already having an impact on the economy, and this will continue for many years to come.

Why it’s a Problem

This particular debt issue is not a repeat of the financial crisis of 2007 that occurred when the housing bubble exploded. Student loan debt is not really a bubble that will pop. It’s more akin to a balloon that will slowly leak.

Most of the debt is carried by Millennials, who were born between 1980 and 2000 and are now roughly 18 to 39 years old. They are now the largest generation in the nation and represent the largest age cohort in the workforce today. Student loan debt is the largest debt load they carry and it will persist for many years hence.1

Debt is hampering overall spending by Millennials in the economy. This is especially evident for the existing housing market and the consumption that goes with it. There is decidedly less home buying during this economic expansion, and that means less homeownership. With lower homeownership, there is less spending on furniture, fixtures, and furnishings. There is less home building, and fewer architectural, engineering and construction services needed.

And other expenditures are being replaced by debt repayment, which produces less economic stimulus than expenditure on private sector goods and services.

Since you can’t get rid of these loans via bankruptcy (like you could with any other debt) borrowers are on the hook for them until they are ultimately paid. The only way borrowers can avert the debt is to flee the country or die.

Default is more likely to have a slow motion impact, in line with the notion of a leaky balloon.

Why there’s no Bubble

Most of the debt will be repaid over time, and both banks and the federal government could well make a profit from these loans. But if delinquency and default rates continue to rise, then the public sector loses.

Federal student loans constitute 85 percent of all outstanding student loans, and most of these loans are backed by guarantee, which means that banks making these loans through 2010 are not on the hook for payment default.2 The federal government is. Back in 2008 when the housing bubble popped, it was the financial institutions that took the loss. This time, it will be the federal government. We don’t expect to see a financial crisis spreading through the private financial sector.

But who really loses? You do. It’s your loss, the taxpayer, since you provide the government with most of its revenues for running government programs like federally insured student loans.

Bubbles burst when asset pricing in markets does not make sense. So a correction occurs. But the price mechanism that corrects does not exist for loans held or guaranteed by the federal government. So what happens?

Consequences Ahead

Taxpayers will be on the hook for providing the federal government with increased revenues to offset the losses. We already have large federal deficits and they are rising. This will only increase the size of the deficit until the public pays for it through taxation.

Education costs will be driven higher as students obtain loans and inundate colleges and universities. This notion was advanced by former Education Secretary William Bennett and is known as the Bennett Hypothesis. Students have relatively easy access to uncollateralized loans and this has led higher educational institutions to raise prices (increase tuition). Consequently, federal student aid has not necessarily made higher education more accessible or more affordable. The resulting education may ultimately not return an income stream that justifies the cost of that education. When this happens, the demand for education will decline.

Colleges and universities that did not contain their costs might become insolvent.

The federal government will continue to change its policies regarding student loans. Right now, it does offer loans to students that need assistance. Everyone else must obtain loans from private institutions. And interest rates on these loans are not always designed to hedge the overall risk factors that could lead to delinquency and default. There will be changes in how we finance higher education.

Look for student loan caps, higher interest rates, and the removal of loan forgiveness options for any borrower.

Finally, we might already be seeing a shift in Generation Z, currently the youngest generation who are just now entering 4 year colleges and universities. They appear to be much more calculating when it comes to higher education and are more apt to factor in college affordability and community college than Millennials were.


————————

1 The standard repayment plan for federal student loans puts borrowers on a 10-year track to pay off their debt, but the average bachelor’s degree holder now takes 21 years to pay off his or her loans. Under federal income-based repayment options, remaining debt is forgiven after 20 years.

2 Under the guaranteed student loan program, private lenders including Sallie Mae and commercial banks issued student loans that were guaranteed by the federal government. The program ended by Congressional mandate on June 30, 2010. Loans made since that date no longer have a government guarantee (unless they are direct government loans, or FFEL). Loans that default by student borrowers are taken over by the federal government and a contracting “guarantee agency” then services the loan. Banks are paid off by the guarantee agency and the latter attempts to collect on the loan.

The California Economic Forecast is an economic consulting firm that produces commentary and analysis on the U.S. and California economies. The firm specializes in economic forecasts and economic impact studies, and is available to make timely, compelling, informative and entertaining economic presentations to large or small groups.


Student Loan Debt: How Serious is it and Where Will it Lead? (Part 1)

by Mark Schniepp
June 2018

Student Loan Debt has Soared

With over $1.5 trillion in loans outstanding, student debt is now the second-largest source of household debt (after mortgage debt) and is the only form of consumer debt that continued to grow during the aftermath of the Great Recession.

The principal concern over the last few years has been the shear volume of student loan debt and the speed at which it is rising over time.

Per graduating student, debt loads are non trivial, and are now at their highest levels ever measured. The average student loan burden for Class of 2017 graduates was $39,400, up 6 percent from the previous year. More than 44 million Americans today carry some student loan debt.

Tuition costs have soared at colleges and universities. Between 1997 and 2017, in-state tuition at public universities jumped nearly 240 percent. During this same period, consumer price inflation increased 53 percent. Consequently, the cost of college and university tuition outpaced the general price level by 5 times.

And relative to expected income, tuition has increased to between 25 and 40 percent of an adult’s median household income. Back in 1970, annual tuition represented between 7 and 20 percent of the annual median household income. The result is that student graduates owe a far greater amount today relative to their current and future incomes than the baby boomer generation who graduated from colleges in the 1970s and 1980s.

Student loan payments average $351 per month for those who carry debt. If your starting salary after graduating from a 4 year university is $60,000 per year, those debt payments represent 9 percent of your monthly take-home income. Clearly, graduates earning less have a higher loan payback percentage of income, and this diverts household spending from private sector goods and services to federal loan repayment, an area of expenditure with a much lower, if any, economic multiplier.

Interest rates on new student loans currently range from 5.05 to 7.6 percent.1 This makes student loans more expensive than paying a mortgage. And this is especially true for graduate students (and parents) who face the highest rates from Sallie Mae. Freshly minted lawyers and doctors can have student loan debt of $200,000 to $500,000, which is often larger than a mortgage.

National University Rankings by Cost of Annual Tuition


School 2018 Tuition 2018 Enrollment 2017-2018 Acceptance Rate
Columbia University (New York) $57,208 25,084 5%
University of Chicago (Chicago) $54,825 13,322 8%
Tufts University (Medford, MA) $54,318 11,489 14%
USC (Los Angeles) $54,259 43,871 17%
Carnegie Mellon (Pittsburgh) $53,910 13,391 22%
Duke (Durham, NC) $53,744 15,928 11%
UPenn (Philadelphia) $53,534 21,826 9%
Boston College (Chestnut Hill, MA) $53,346 13,851 31%
Cornell (Ithaca, NY) $52,853 22,319 14%
Georgetown (DC) $52,300 18,525 17%
Source: US News, Best Colleges, 2018 National Rankings

The size of student loan debt and its growth over time has previously been the focus of attention, but now a growing concern is the default rate among borrowers.

Delinquency

New data show that delinquency rates on student loans may be going as high as 40 percent of borrowers by the year 2023. The default rate is already higher than anticipated for the particular student cohorts studied, so the federal government should be bracing for substantial non payment of debt.

Currently 58.5 percent of all direct student loans are in repayment, and 41.5 percent are not. Regarding those that are not, 23 percent are in deferment or forbearance, meaning the repayment is temporarily suspended with or without interest, on the request of the borrower. Five percent are still in the grace period and 15 percent are in default.

When a borrower defaults, he or she simply fails to pay interest or principal on a loan when due. So if the loan is federally insured, as most loans were up to mid-2010, then the Federal Government is on the hook. It’s the same thing as when the U.S. loans a few billion dollars to the Cayman Islands and they don’t pay it back. In fact, as of 2017, the Caymans owed the U.S. $302 billion. Canada owes the U.S. $380 billion. Neither of these countries is likely to default however, but countries have in the past like Mexico in 1994 and Argentina in 2001. And we can’t trace these defaults to an impact on our economy.

Can students merely declare bankruptcy to avert paying back the loan? No. Student loan debt is virtually inescapable and is precluded from debts that are dischargeable in the U.S. bankruptcy code.

Consequently, there are increasing stories online reporting how debt strapped former students are fleeing the country and hiding out from Sallie Mae and collection agencies.

Sallie Mae is the nation’s largest originator of federally insured student loans. It was formerly a GSE, but it is now entirely independent from the federal government.2

Is the Potential Flood of Defaulting Student Loans Another Looming Financial Crisis?

1. First, the Basics

Our lending systems generally work efficiently and borrowers don’t default on debt because lenders won’t make too many high risk loans. System risk rises when lenders extend unwarranted credit. This occurred during the housing bubble days of 2004-2007 when easy credit gave rise to massive home buying pushing selling values to record levels.

A bubble “pops” when prices correct to more accurately represent the intrinsic value of the asset. Clearly, home prices towards and at the peak exceeded the true value of those homes. Prices corrected, borrowers owed more than the home was worth, and there were unprecedented numbers of defaults and lender bankruptcies. Loans ultimately became restricted and this slowed down the economy because businesses had difficulty obtaining capital needed to grow, invest, and hire.

2. Student Loans

Is the current student loan debacle a bubble? And if so, when will it burst?

I’ll address this in the upcoming July newsletter.


———————

1 https://www.credible.com/blog/refinance-student-loans/what-are-average-student-loan-interest-rates/

2 A GSE is a government-sponsored enterprise, or a financial services corporation created by Congress to enhance the flow of credit to particular economic activities such as agriculture, home finance, and education.

The California Economic Forecast is an economic consulting firm that produces commentary and analysis on the U.S. and California economies. The firm specializes in economic forecasts and economic impact studies, and is available to make timely, compelling, informative and entertaining economic presentations to large or small groups.


An Update on the Recent Economic Evidence

by Mark Schniepp
May 2018

No Suprises

The employment report for April produced no surprises. Job gains remain relatively strong, the unemployment rate continues to tighten, and wage growth is ahead of inflation. It is curious that wages and salaries are not rising faster given the tightness of the labor market. This is disappointing for workers but it will keep the Fed on track for three rate hikes this year because inflation remains predictably in check. It’s likely that stock market volatility will also subside, at least for the meantime.

Why the Probability of Recession is So Low

The probability of recession rose in March but still remains low. The odds of a recession this year should be low because recessions occur when imbalances develop in the economy, and no glaring potential macroeconomic imbalances are forming.

The labor markets continue to create more jobs, and the financial markets, while exhibiting more volatility since January, still remain buoyant. A fully employed economy, rising housing values, improved access to credit, and low household debt are driving both the consumer and business investment engines of economic growth.

Consumer confidence remains near its highest level in a generation. The present economic climate is rated consistently more favorably while economic expectations remain strong.

Consumer confidence at these stratospheric levels is consistent with a fully employed economy, households with rising real wealth and low debt, and low inflation.

Further tightening in the labor markets is likely this year, even as the pace of job growth continues to moderate. Employment growth has gradually declined toward 150,000 jobs a month in the U.S. and 20,000 jobs per month in California. This moderation is expected to continue through the rest of 2018.

A decrease in job growth is not abnormal at this stage of the business cycle and should not be mistaken for an economic slowdown. However, as long as job creation continues to exceed the flow of entrants to the labor market (80,000 to 100,000 a month), the unemployment rate is very likely to fall to 3.5 this year. Currently, the rate is at 3.9 percent.

Slower population growth and aging of the population will continue to exert downward pressure on labor force participation rates which will restrain labor force growth.

Growth in the economy in 2018 and 2019 will have to be accommodated with fewer additions to the workforce, due to slow growth in the labor force and a labor market that has very little slack. Consequently, look for much greater investment in automating business processes and functions. This has been the subject of my March and April newsletters.1

The environment in California is even more austere regarding labor market capacity. The unemployment rate has now reached a level that it has not achieved since the late 1960s. And predictably, wages have been rising more sharply here than in the rest of the nation over the last 18 months.

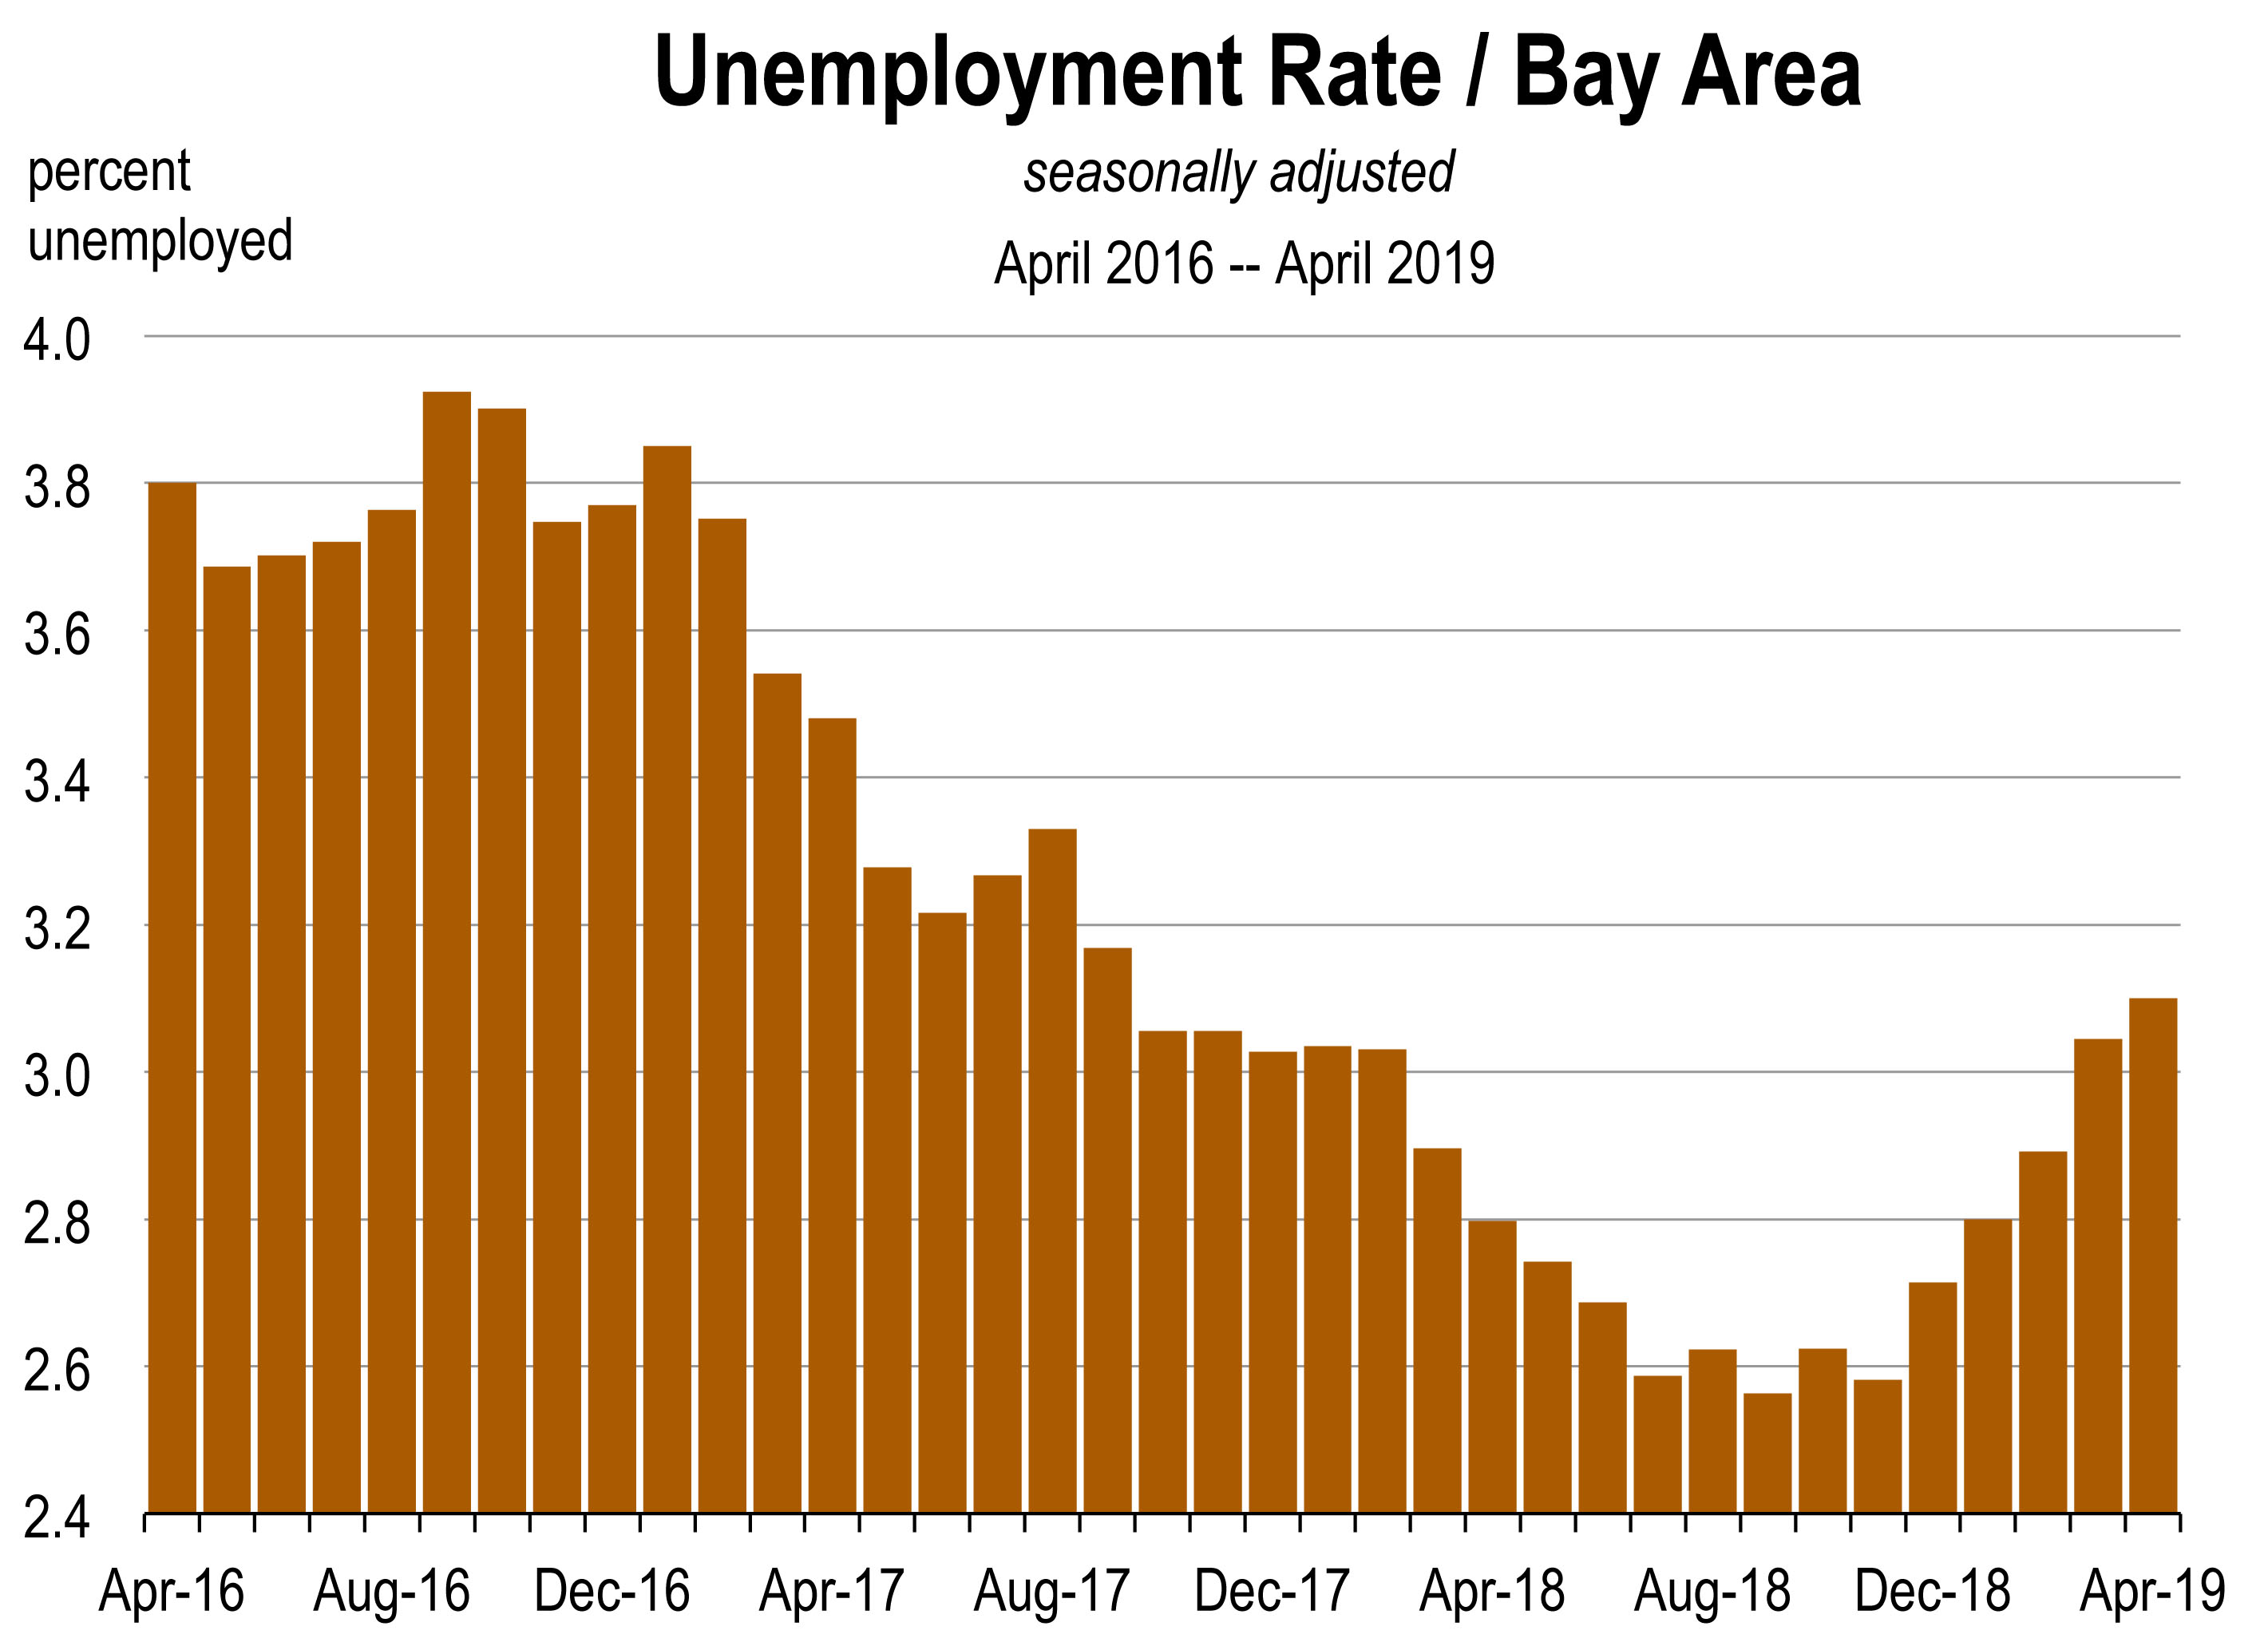
This year employee compensation is forecast to rise 4.0 percent compared to a 2 percent increase in 2017.2 Average salaries are forecast to rise 3.0 percent in California this year, after relatively hefty gains of more than 3.0 percent in the Bay Area economy during 2017.

The Updated Forecast

Even though the stock market has been under pressure since January (largely because of rising interest rates), the rest of the economy has remained more steady. This includes consumer spending, business investment, manufacturing, and surprisingly, inflation.

I believe that economists are much more focused on inflation than previously, because the labor markets should be producing faster wage growth now.

We are watching for any unexpected movements in inflation because that would pose one of the bigger risks to interest rates and the economy this year.

That said, nothing seriously out of the ordinary is within view. At our vantage point right now, it appears that the economic indicators for 2018 will remain auspicious.

The consensus forecast has real GDP still on track to expand at a pace of close to 3.0 percent this year with a slowdown strongly projected for 2019 and 2020.

———————

1 For all of the monthly newsletters of the California Economic Forecast for the 2018 calendar year, please go here: https://californiaforecast.com/monthly-newsletter/

2 UCLA Anderson Forecast for the State and Nation, March 2018, page Nation-15.

The California Economic Forecast is an economic consulting firm that produces commentary and analysis on the U.S. and California economies. The firm specializes in economic forecasts and economic impact studies, and is available to make timely, compelling, informative and entertaining economic presentations to large or small groups.