So if we now have a “full employment” economy, why aren’t you convinced?

by Mark Schniepp
October 2016

Is the unemployment rate really full?

We are now at or within months of an economy at “full employment.” This means that (1) anyone wanting a job can obtain one, and (2) labor is tight and the general level of wages and salaries is rising as a result. Evaluation of the data on unemployment, help wanted indices, and wage increases shows that both of these criteria are now being met.

full-employ_fortune_020516
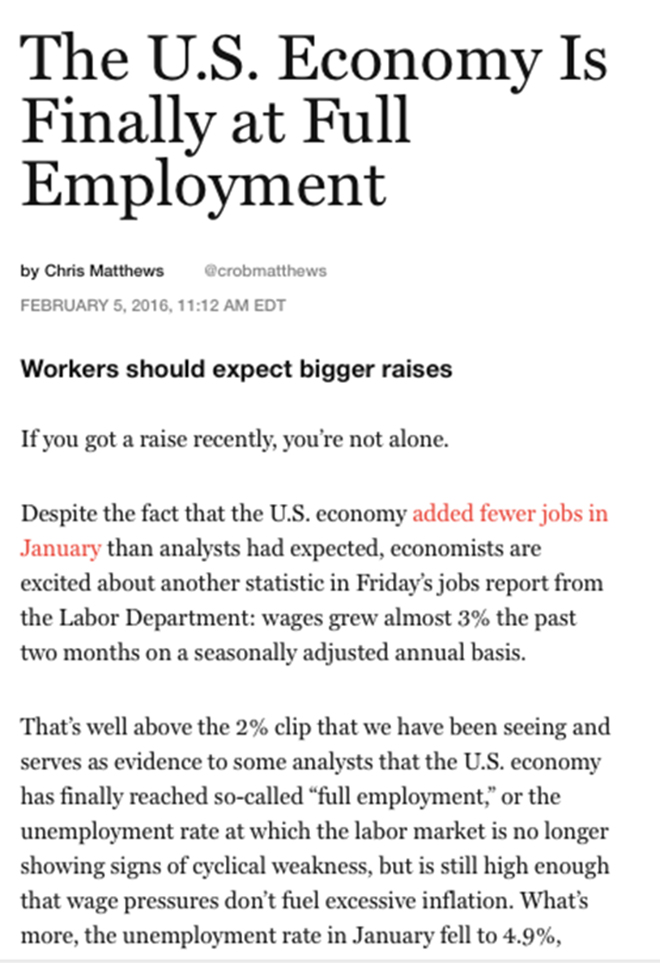
Fortune, February 2016, online

Is it really fair to use the term “full employment” when people are still experiencing difficulty finding work?

Unemployment is both regional and variant by age. The rate in Tulare County last month was nearly 10.7 percent. In San Mateo County, it was 3.2 percent. If you’re 19 and fresh out of high school, it’s going to be a lot tougher than if you’re 41 with 15 years of work experience.

California NAICS NSA.xlsUnderemployment

A discouraged worker is a person of legal employment age who is not actively seeking employment or who has not found suitable employment after long-term unemployment. This is usually because an individual has given up looking or has had no success in finding a job, hence the term “discouraged.

Often the conventional unemployment rate is criticized because it does not account for discouraged workers that have dropped out of the labor force and are therefore, not counted in the unemployment rate.

Often we are criticized for declaring that full employment has been reached in particular regional economies since people believe that there is still a significant level of “underemployment.”

Labor that falls under the underemployment classification includes those workers who are highly skilled but working in low paying jobs, workers who are highly skilled but working in low skill jobs and part-time workers who would prefer to be full time.

U-rates (3,4,5 & 6).xls
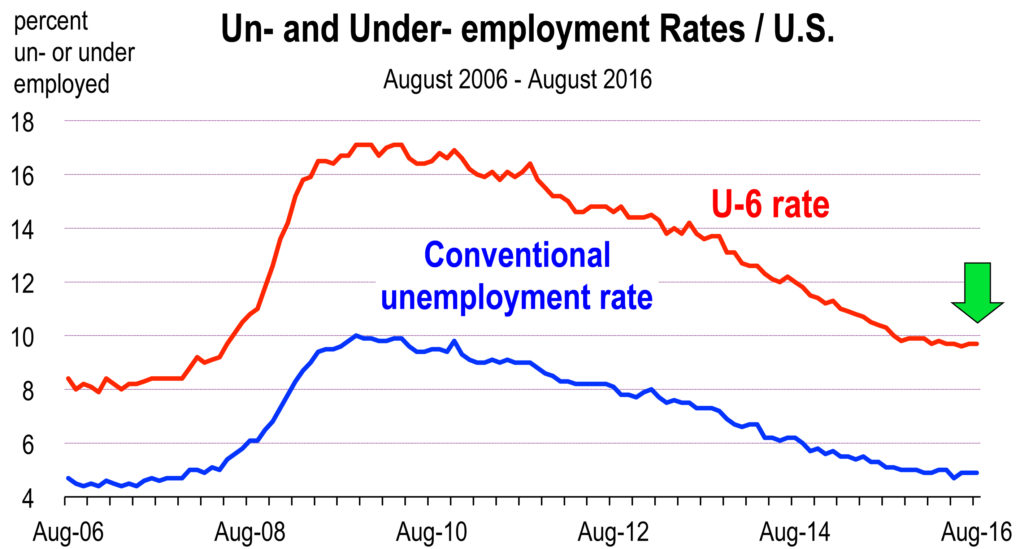
An alternative measure which seeks to explain underemployment is called the U6 unemployment rate. It expands the definition of the labor force to include “discouraged workers,” or people without jobs who have given up looking for work; “marginally attached workers,” or people without jobs who would like to work but have not sought employment recently, plus people employed part time (less than 35 hours/week) who would prefer to work full time.

Now, U-6 does not fully explain “underemployment” because there is no statistic that can quantify workers who are working in jobs below their perceived skill level. Therefore we don’t have a perfect measure for underemployment.

U-6 for August 2016 was 9.7 percent, or approximately twice the conventional unemployment rate of 4.9 percent. But U-6 has always been at a level that is approximately twice the conventional rate. Since 2008, the average difference between the two rates has been 6.2 percentage points. Today the difference is 4.8 percentage points.

The lowest reading for U-6 (since 1994 when the statistic started tracking) has been 6.8 percent in October of 2000.

While it is true that U-6 today is not quite back to the low level of 8.4 percent that prevailed prior to the Great Recession, neither is the conventional unemployment rate. Nevertheless, we are at or close to full employment and the U-6 rate today is consistent with historically low levels of that measure.

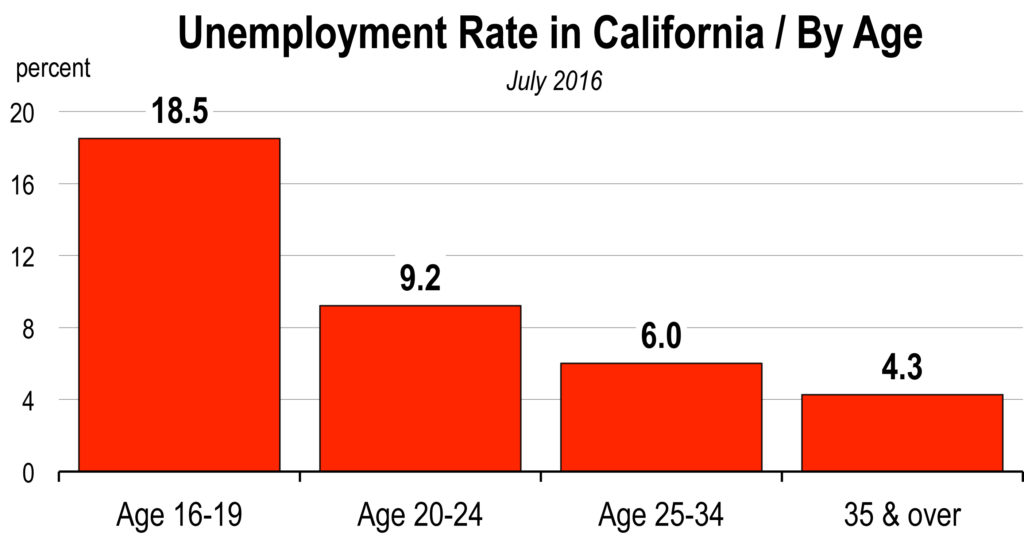
Who are the unemployed and the underemployed today?

The legal working age population ages 16 to 24 is the principal group that is either out of work or underemployed. The unemployment rate for this age group is currently 9.2 percent (versus 4.3 percent for the 25 to 54 year old age group).

U-rates (3,4,5 & 6).xls
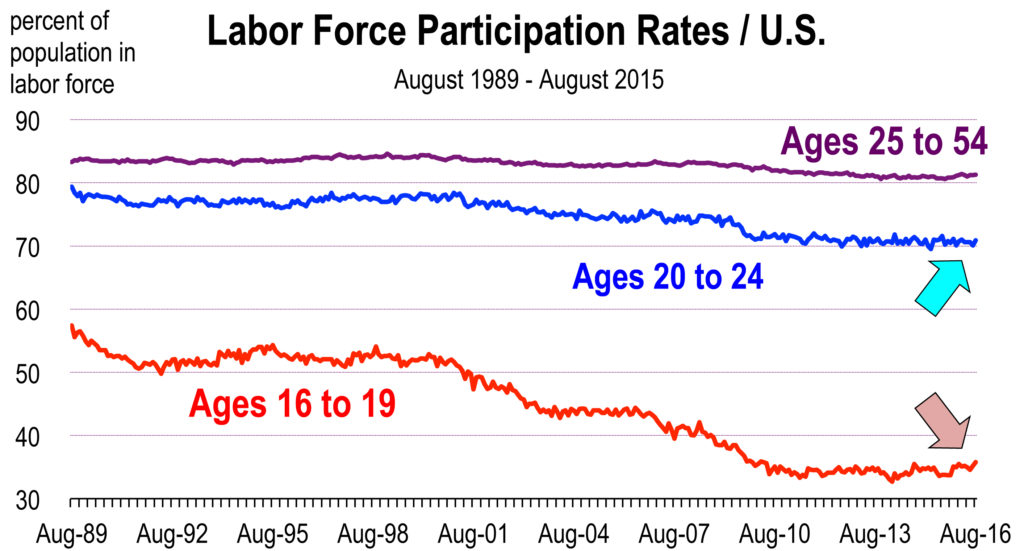
Furthermore, this age group has very low rates of labor force participation compared to the 25 to 54 year old age group. Attending high school, colleges and universities is a large reason for the reduced rates of participation, but does not fully account for the collapse in rates over time. All groups are showing a decline in labor force participation over time, but the younger age group participation rates have tumbled, whereas the 25 to 54 year old group is off only 3 percentage points from the all time record high of 84.5 percent reached in August 1997.[1]

Higher rates of unemployment and lower participation rates for 16 to 19 and 20 to 24 year olds is consistent with their lack of training, knowledge or skill in a modern technical and highly automated economy where these attributes have much higher value today than previously.

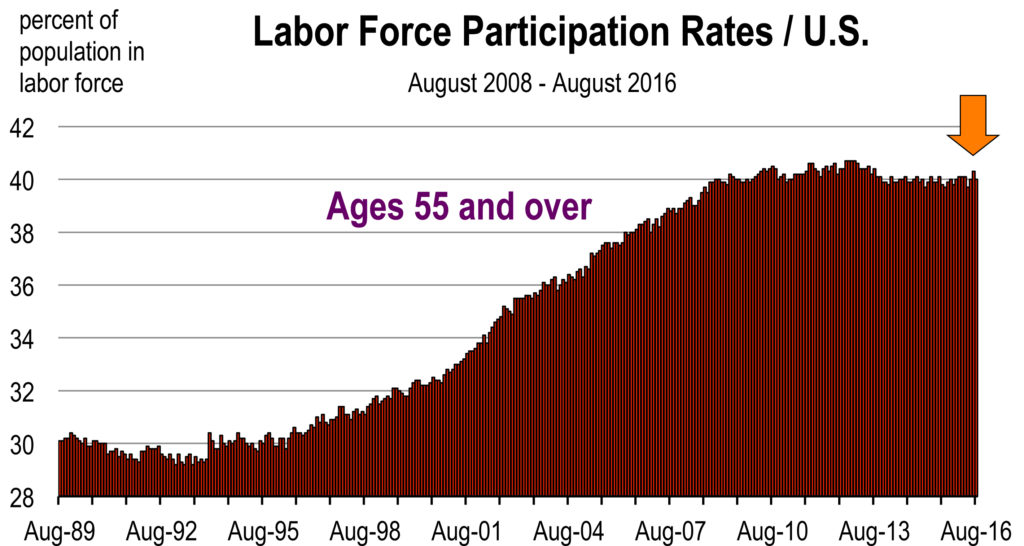
Moreover, labor force participation rates for the population aged 55 and over have been increasing for the past 24 years and are now at their highest levels since 1964. The older Baby Boom generation is educated, experienced, and skilled. They show very little sign of being discouraged in today’s economy, according to this statistic. Oh, and their unemployment rate in August was only 3.5 percent, the lowest of any age group.

U-rates (3,4,5 & 6).xlsConclusion

Unemployment is low for most of the labor force aged 25 and above. And the rate of unemployment appears to be both full and absent any unusual degree of underemployment for this age group. Baby Boomers are not the discouraged workers in today’s economy.

The rate of unemployment and underemployment is substantially higher for 16 to 24 year olds. The implications of this strongly support the critical need for higher levels of education and/or training of this age group, today and going forward.

It’s not enough to simply attend a university today and obtain a Bachelor’s degree. The kind of degree that students seek will have a much bigger impact on their employability and their future earnings than it did for the Baby Boomers.

————————————————

[1] The participation rate for 20 to 24 year olds was nearly 80 percent in August of 1989. Today, it has declined to 70.9 percent. The 16 to 19 rate fell from 57 percent to 36 percent over this same time period.

The California Economic Forecast is an economic consulting firm that produces commentary and analysis on the U.S. and California economies. The firm specializes in economic forecasts and economic impact studies, and is available to make timely, compelling, informative and entertaining economic presentations to large or small groups.

No Recession, Because We Don’t Deserve One

by Mark Schniepp
September 2016

Recession in 2017?

We are now more than seven years into the current economic expansion, having officially pulled out of the Great Recession in July of 2009. Consequently, the “up” phase of the current business cycle is getting old because they don’t typically last longer than 8 or 9 years. Yet if you google “recession in 2017” you’ll see a full page of articles predicting recession next year.


pcbt-article

Pacific Coast Business Times, September 8, 2016, online

What do you think? Are we headed for a recession in 2017? I argue here that we won’t see a recession simply because we don’t deserve one, yet.

US Quarterly IndicatorsWhy Don’t We Deserve a Recession?

We haven’t demanded any particular good or service into excessive oblivion. We don’t have technology stocks that are valued way out of whack (like in 2001), we don’t have bubble housing prices (like in 2006), and we don’t have major household debt (like in 2007). In fact, economic data regarding households or businesses is not out of balance.

 We have record vehicle sales because people are employed and have rising incomes, gas is cheap and is threatening to remain so, and many cars and trucks simply need replacement.

CAR Southern California.xls
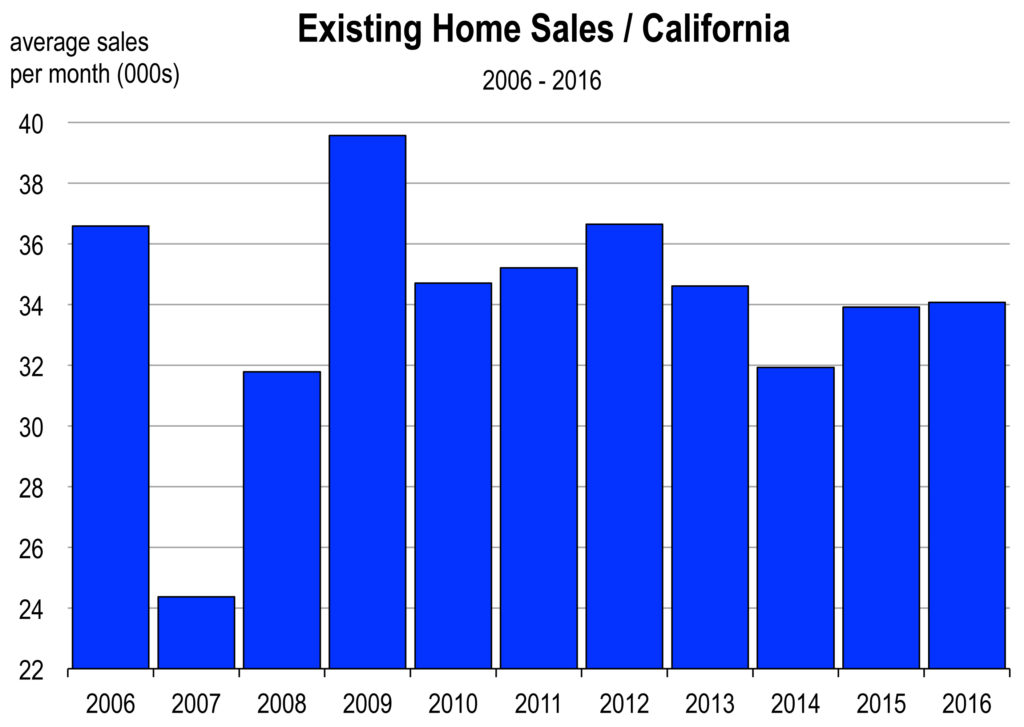
We have record stock market valuations because corporate profits have been strong, everyone’s working, inflation is contained, and the American economy is growing, relative to many of our global neighbors. The market is clearly not convinced that a recession is inevitable; otherwise stock prices would be eroding.

Homes are selling but at rates way below the bubble days. And this time, buyers can actually afford these homes, largely because interest rates are so low.

Home prices are rising and at unprecedented levels in some areas, like the Bay Area. But the underlying force to home demand in California is supply and demand, and not easy financing and/or a surge of new home development. Currently, for-sale housing inventory is very low (as is new home inventory), especially in the red hot Bay Area and that’s why home prices are 25 to 30 percent above the bubble peak!

US Quarterly Indicators
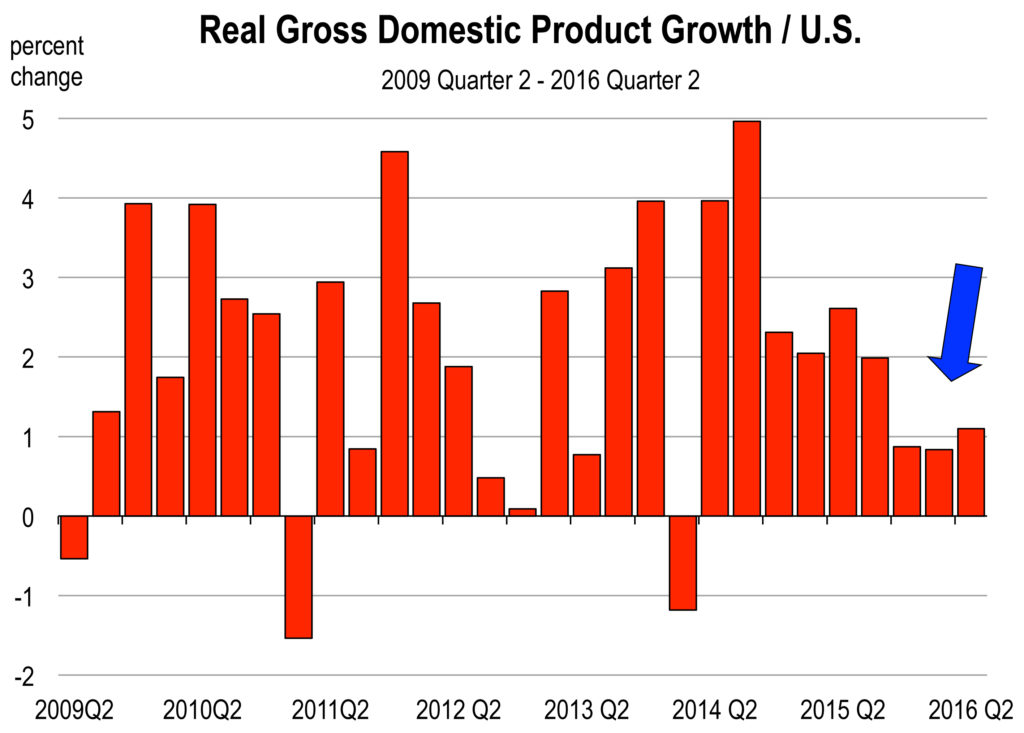
The upward movement of GDP this year has been stunningly slow, and is now running at a 1.5 percent rate of growth (we were in the mid 2s in 2014 and 2015). U.S. growth has historically averaged over 3 percent, and about 2 percent per year since the economy started growing again in mid-2009.

The very poor GDP numbers this year have spooked many analysts into predicting a recession. But we don’t buy it. There are not many imbalances, no bubbles, and consumers are not stressed or overleveraged.

And it appears that the European economy is strengthening and China’s stock market is slowly recovering. So the world economy is, at the moment, not threatening to hinder U.S. growth for the foreseeable future. Not even Britain.

We don’t deserve a recession. We haven’t done anything wrong. So we’re not likely to get one. And therefore we don’t see much chance of recession next year.


________________________________________________________________________________

2016_vc_2_banner-for-website

Our conference in Westlake last week was another big success. We hand many sponsors and a large crowd at our 39th semi-annual event. Our next event is scheduled for February 2, 2017 at the Westlake Hyatt.

Plan to be at the largest and longest running economic forecast in Ventura County. And we do provide a forecast, a very thorough one, in our presentations and in our publications, for both Ventura County and Los Angeles County.

The California Economic Forecast is an economic consulting firm that produces commentary and analysis on the U.S. and California economies. The firm specializes in economic forecasts and economic impact studies, and is available to make timely, compelling, informative and entertaining economic presentations to large or small groups.

Economic Progress to Date in 2016

by Mark Schniepp
August 2016

The unemployment rate for the nation remains under 5.0 percent, and has essentially reached the “full employment” level. Wages are now rising on their own accord and not due to any government mandates.

GDP growth during the first half of the year has not been stellar, rising only 1.2 percent on an annualized basis. That’s a pretty poor estimate of overall growth in the U.S. economy. Yet, the economy continues to hum along with an unending record of monthly job creation, low rates of inflation, imperceptible interest rates, cheap energy, and record stock market values.

Stock_Market.xls

The Nasdaq Composite Stock Index closed at an all time record high on August 1, 2016.

Oil prices are sinking again. Food prices were 1.3 percent lower in June 2016 than a year ago. The general inflation rate for the first 6 months of the year is 1.0 percent. In the Southern California region, it’s 1.8 percent. Higher inflation rates were originally forecast, due in large part to higher home prices and rents and slightly higher energy prices. And while we are observing higher rates of inflation in California, they are still relatively contained.

The interest rate story continues to be a dream for homeowners. The recent surge in refinance activity that we saw in June and July will produce more spendable income for households this year. Along with lower gasoline prices, consumers have more income to spend on stuff other than housing and fuel.

The U.S. dollar is strengthening again after weakening in March, April, and early May. The trend line in the value of the dollar against all other currencies has been rising since late May. Today there are nearly 19 pesos to the dollar. Last year at this time, the dollar exchanged for 15 pesos. Therefore, go to Mexico and drink tequila, cheaply.

California NAICS NSA.xls
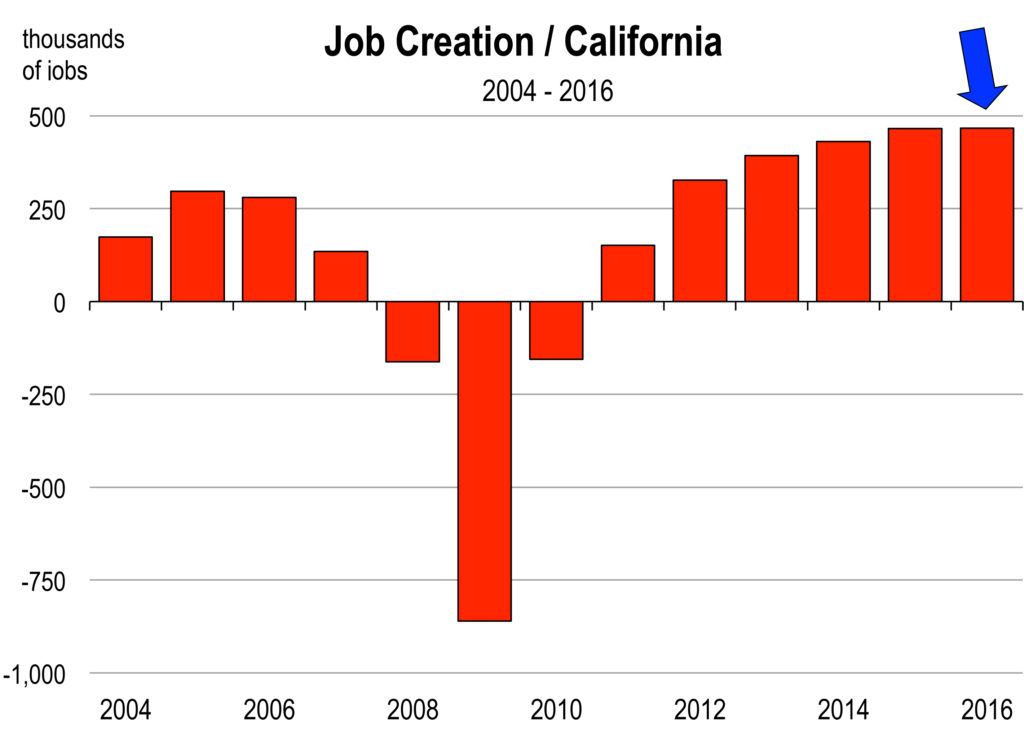
In California, 40,000 jobs were created in June. The pace of new job formation for 2016 to date will result in more than 470,000 new jobs this year, which is a remarkable accomplishment at this stage in the economic expansion.

Since February 2015, monthly job openings have outnumbered hires as the availability of work opportunities has soared.

There will be no economic slowdown as we enter the fall season and the general presidential election. And though it’s always the economy stupid, it’s not so much this year because the economy remains solid with few soft spots.

The most favorable markets in the country for job seekers are those areas where job openings exceed the number of unemployed workers. As of July, the ratio of the unemployed to job openings was the lowest in the following major metro areas:


Metro Area Ratio of Unemployed People to Job Openings
Salt Lake City 0.68
San Jose 0.71
Minneapolis 0.72
San Francisco 0.77
Denver 0.77
Washington, D.C. 0.79
Boston 0.84
Austin 0.88
Nashville 0.93
Seattle 1.00
Source: Conference Board, July 6, 2016

So, if you are looking for a job, move to one of these areas for the highest probability of finding the job you want. There are 5 months left in 2016. Make the most of them. Now is the time to refinance your home, take a vacation, change careers, or fill up your gas tank.

_________________________________________________________

Upcoming Event

2016_VC_2_Banner for website

Entrepreneur Economic Forecast Conference / Los Angeles and Ventura Counties
September 8, 2016
Westlake Hyatt
7:30 am to 10:45 am

Speaker topics will include:

How long can the current expansion last?
What about interest rates and inflation?
The 2016 El Nino fizzled; can we tolerate another year of drought?
What are the recession risks going into 2017?
Is Ventura County still lagging its peers?
Has commercial real estate peaked?

Event Info Register Now

The California Economic Forecast is an economic consulting firm that produces commentary and analysis on the U.S. and California economies. The firm specializes in economic forecasts and economic impact studies, and is available to make timely, compelling, informative and entertaining economic presentations to large or small groups.

Brexit Will Be a Slow Burn, Not a Hot Flash

by Ben Wright
July 2016

Many commentators have suggested that a British vote to leave the European Union would lead to global recession. They have drawn comparisons to the crisis in 2012 when large government deficits threatened to push Greece out of the EU. But Britain is not Greece for one important reason: Britain has its own currency.

Britain is not Greece

The Greek situation was dangerous because Greece uses the Euro, the currency it shares with 18 other nations. An exit from the EU would have forced it to abandon the Euro overnight and renegotiate its financial contracts, creating real problems for the banking system and threatening a replay of the crash of 2008.

But the United Kingdom uses the Great Britain Pound, one of the oldest currencies in the world, and no current geopolitical scenarios will alter this. The British national economy faces other issues, but the Pound will retain a prominent role in the global economy, and there is little risk that Brexit will mushroom into an international catastrophe.

The Short-Term Volatility is Over, But UK Growth Will Lag

Stock_Market.xls
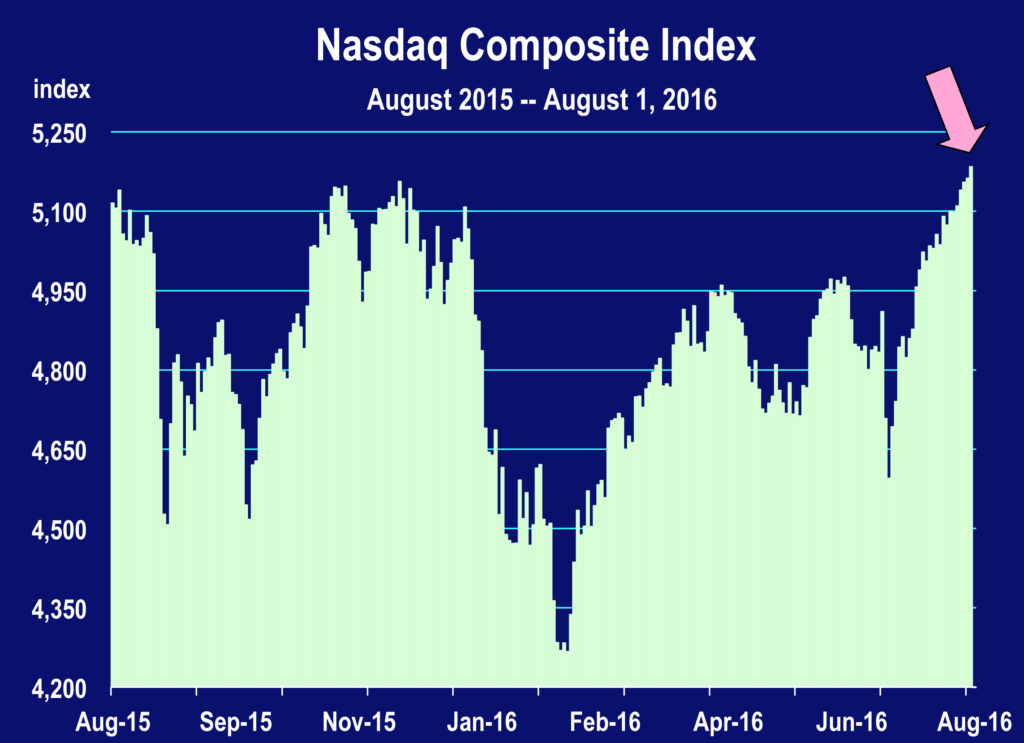
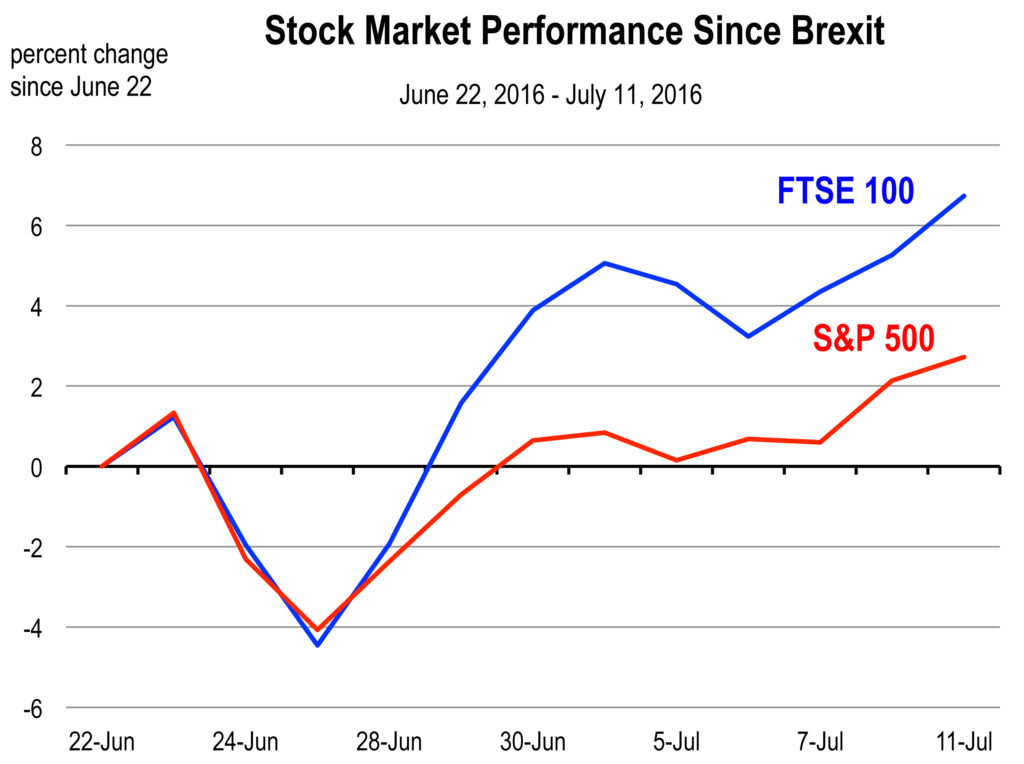
In the minutes and days after the vote, stock markets tumbled around the world. Bond yields fell and the Dollar strengthened as investors rushed to safe haven assets. This was a predictable reaction to a burst of uncertainty, but the turmoil has now subsided and markets have calmed. The S&P 500 has reached a new high, and the index of British blue chips has surpassed its pre-Brexit value by more than 6 percent.

But the short-term effects were never the real danger, and new issues will unfold over the coming months and years. If English officials do not strike a new trade agreement in Brussels, their economy stands to lose substantial ground over the long term.

The UK is a large exporter of industrial machinery, aircraft, and other high-value goods. But so are Germany, France, Italy, Finland, and a number of other EU nations. Without a trade agreement, British goods would be subject to new tariffs, making them more expensive and less competitive in the global marketplace.

Over time, it’s likely that some of the UK’s trading partners would find new suppliers, which would slowly erode the manufacturing sector. Ironically, the industrial hubs that supported Brexit could be the biggest losers. It was developing nations like China and South Korea, not other European countries, that were their main source of competition.

Without free access to the European market, some firms would relocate to other parts of the EU, and others would delay investment into their UK operations. The most important may be the banking sector, which is arguably the preeminent hub of global finance. Some reports have estimated that London could lose 10,000 banking jobs over the coming years, relocating them to Frankfurt, Amsterdam, and other cities with existing financial infrastructure. Those first to leave may be at multinational firms that already have other EU offices.


Finance Jobs at Select Multinational Firms
Company Total Jobs in London Jobs Likely to Leave London
Citigroup 8,000 2,000
Goldman Sachs 6,410 1,603
Bank of America 5,545 1,386
Morgan Stanley 5,000 1,250
J.P. Morgan Chase 16,000 1,000
Source: Keefe, Bruyette & Woods, Inc.

Britain would almost certainly see lower levels of in-migration – their only current source of population growth. It’s very hard for an economy to grow without new additions to the workforce, and if migratory patterns reversed and the resident base began to decline, economic expansion would be considerably muted. Just look at what’s happening in Japan.

In total, economists estimate that the loss of trade, investment, and in-migration could reduce GDP growth by up to $260 billion over the next decade, and would place a drag on wages by upwards of 7 percent. UK households could lose $2,600 in annual purchasing power, and British exporters may lose 50 percent of their market share within the European Union. A recession is unlikely, but can’t be ruled out because the British economy was slated for slow growth even if the “Remain” campaign had prevailed.

Pain Will Be Concentrated In the UK

When growth slows in an economy as prominent as Great Britain – currently the 5th largest in the world – it tends to influence conditions elsewhere. But the global effects of this scenario are expected to be mild.

Economists estimate that the U.S. would have grown by 2.5 percent over the next year, but have downgraded their forecasts to 2.0 percent, largely due to the drag from less favorable exchange rates. The Fed was ready to raise interest rates in July or September, but will now almost certainly wait until December or later, and international interest rates will remain lower than if Brexit had never occurred. US companies that have operations in the UK will reassess their options, and may lose some of their EU business.

The British economy stands to lose a substantial amount of trade, but some of this activity may simply shift to their EU competitors. Some of the migrants heading to London or Manchester will instead choose Paris or Munich. Barriers to trade are usually contractionary, but in this case there will be a meaningful substitution effect.

In general, outside of Her Majesty’s Kingdom, most of the world will take this situation in stride.

The California Economic Forecast is an economic consulting firm that produces commentary and analysis on the U.S. and California economies. The firm specializes in economic forecasts and economic impact studies, and is available to make timely, compelling, informative and entertaining economic presentations to large or small groups.

What Happened to Higher Interest Rates This Year?

By Mark Schniepp
June 2016

Interest Rates

Road Sign Higher RatesThey were supposed to go higher in 2016—not sharply higher but noticeably higher nonetheless.

As you may recall, the Fed raised the federal funds and discount rates last December. This was the first such lift in rates since 2006. The conventional wisdom based on their remarks was that rates would be raised in a gradual fashion throughout 2016 and 2017.

But worries about the slowdown in China spooked the stock market at the beginning of the year and the Dow tumbled 1,900 points during the first 3 weeks of January. The U.S. manufacturing sector was sliding and durable goods orders were shaky. So the Fed held off raising rates in March. It’s now June and they meet on the 15th. Another rate hike is now called for but wait, the employment report for May that just came out last Friday was a huge downer. Is that going to dash (postpone) another opportunity to push rates higher?Interest Rates-D

Perhaps…. or perhaps not. With the 10 year Treasury Bond yield falling to 1.64 percent on June 10, just a few days before the Fed meets, bond traders certainly don’t think the Fed will make another move. And one of the continued reasons cited is that as we get closer to the election this year, policy moves by the Fed will be interpreted as political, and I think they’d like to avoid that. But next week is far enough away from November and that’s why it’s a good option.

The Actual Rate Hike Itself Doesn’t Matter but Rates Need to be Raised

But it really doesn’t matter because another ¼ point hike in rates won’t impact much of anything. As the Fed has announced, a quarter point increase would be negligible but is a sensible first step to ensure the Fed stays ahead of inflation. Inflation remains on the radar screen and the Fed risks roiling world markets and pushing up the value of the dollar.

Stock_Market.xlsWith the economy on the verge of full employment, there is growing evidence of wage and salary inflation, and that will translate into higher general price inflation than what we observe today.

With oil prices rising again, you probably are noticing slightly higher gasoline prices every week. There’s also a likelihood that your healthcare premiums will rise this year or next. And housing costs are clearly moving higher, for home buyers and for renters.

Higher expected inflation should push all market rates higher this year, unless those expectations are dashed because of offsets, such as a slower growing economy either here or abroad from our dominant trading partners.

Our forecast of inflation for 2016 is higher, and higher still in 2017. All the more reason why rate hikes are necessary, let alone warranted. The uncertain outlook for global growth should not stand in the way of the Fed resuming its path toward normalization of rates next week.

What is the Forecast for Rates Over the Next 18 Months?

Our forecast 18 months ago was for much higher rates today. But Europe got in the way, and then China. Now it’s the employment report, the presidential election, or whatever….

We are still sticking to a higher forecast of rates because the Fed wants to raise rates, the Fed needs to raise rates, and the market will push rates higher as inflation becomes more apparent.

Sotelo_out.xlsx

____________________________________________________________________________________

Upcoming Event

Entrepreneur Economic Forecast Conference / Los Angeles and Ventura Counties
September 8, 2016
Westlake Hyatt
7:30 am to 10:45 am

Speaker topics will include:

How long can the current expansion last?
What about interest rates and inflation?
The 2016 El Nino fizzled; can we tolerate another year of drought?
What are the recession risks going into 2017?
Is Ventura County still lagging its peers?
Has commercial real estate peaked?

Online registration will be available July 1st

The California Economic Forecast is an economic consulting firm that produces commentary and analysis on the U.S. and California economies. The firm specializes in economic forecasts and economic impact studies, and is available to make timely, compelling, informative and entertaining economic presentations to large or small groups.

Where is Residential Real Estate Going?

by Mark Schniepp
May 2016

Housing Market Update

Housing-MarketHome prices continue to rise this year, especially in the California coastal markets. Home sales are running at a similar pace as last year—not too hot and not too cold.

There is less inventory everywhere, and this includes new housing along with existing. The average number of years sellers owned their home before selling jumped to 10 in 2015—the longest period ever recorded from an annual survey that began 30 years ago.

Low housing inventory is the biggest concern among California realtors, followed by housing affordability.

There are more home buying age people than ever before, and most of them are employed and their wages or salaries are finally rising. Consequently, the labor market is at peak condition to be generating home buyers.

CAR Trends Data.xlsx
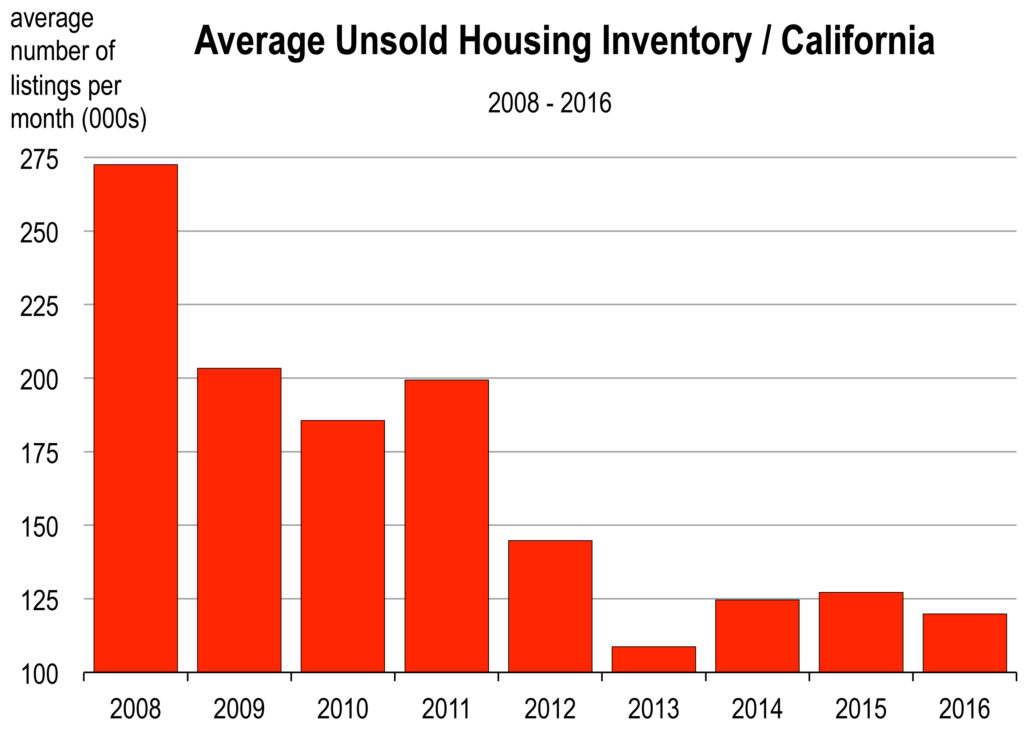
I have addressed the Millennials many times in these monthly reports. But let me reiterate what we are seeing or not seeing regarding them and the housing market:

The percentage of first time home buyers has slipped to the lowest level since 1987 (28 years ago).

Home ownership for persons aged 35 and under is now at 34 percent, the lowest rate on record. Millennials clearly have decided that ownership housing is not yet for them.

And that’s because of the onerous student debt burden they carry, along with rising apartment rents which make saving for a down payment extremely difficult. And a larger downpayment is needed because housing values are at their highest levels since 2009.

Mortgage rates are still extremely low–like routinely under 4.0 percent for fixed rate loans—and more lenders are easing loan criteria.

However, these conditions are not necessarily producing a surge in demand for homes because the Millennial generation is not seeking ownership housing like past generations did at their age.

Consequently, if you suspect a housing market that is not quite as vibrant as you’d like it to be or as it might have been in recent years, that’s because there has been little improvement in the rate of sales, or the growth of inventory to sell.


Selected Median Home Selling Prices / March 2016
and change from year ago
County Region Selling Price ($) % Change
San Francisco Bay Area 1,360,600 6.7
South Santa Barbara County SoCal 1,200,000 -6.3
South Santa Barbara County (less Hope Ranch and Montecito)
SoCal 1,055,000 2.6
Santa Clara Bay Area 1,065,000 14.3
Alameda Bay Area 762,570 6.9
Riverside SoCal 355,590 7.2
San Bernardino SoCal 237,350 10.1
Stanislaus Central Valley 262,390 8.3
Contra Costa Bay Area 572,620 16.4
Entire Bay Area Bay Area 761,170 4.2
Fresno Central Valley 230,880 7.9
Napa Bay Area 666,670 18.5
Orange SoCal 721,140 3.6
San Joaquin Central Valley 297,370 9.1
San Diego SoCal 573,580 8.1
Ventura SoCal 620,020 3.9
Source: California Association of Realtors, Santa Barbara Association of Realtors


Higher end properties are not being purchased as much this year as last. That may involve the stock market, which has moved upward since January 2016, but has made no net improvement over the last 12 months, or since May of 2015.

Is the Market at the Top Yet, for this Economic Cycle?

I don’t believe there has been any top in the real estate market yet. At least not regarding transactions. Home prices should continue to move higher, albeit at a slower pace than what we’ve observed since 2012. Low inventory because homeowners are not selling, and low demand from the Millennial generation make this real estate market very different from past ones.

It appears that for the short term, more of the same is the most likely direction for the housing market.

The California Economic Forecast is an economic consulting firm that produces commentary and analysis on the U.S. and California economies. The firm specializes in economic forecasts and economic impact studies, and is available to make timely, compelling, informative and entertaining economic presentations to large or small groups.

2016 Economic Assessment

And though we said no recession this year…… we still mean it

by Mark Schniepp
April 2016

2016 Recession Update

I’m reading a lot about economic recession lately. A recession that is seemingly looming and could strike the nation THIS year. It’s become a popular internet topic in view of the Chinese stock market collapse, the negative interest rates in Europe and Japan, the UK wanting out of the European Union, and the recent slowdown in U.S. corporate profits and retail sales. We know that first quarter GDP has struggled to remain positive.

Recession scan

This is one of the many “blogs” I’ve come across. This one was published in Investopedia in early March. Others appear on the Fortune, Bloomberg, and CNBC websites this year.

Stock_Market.xls
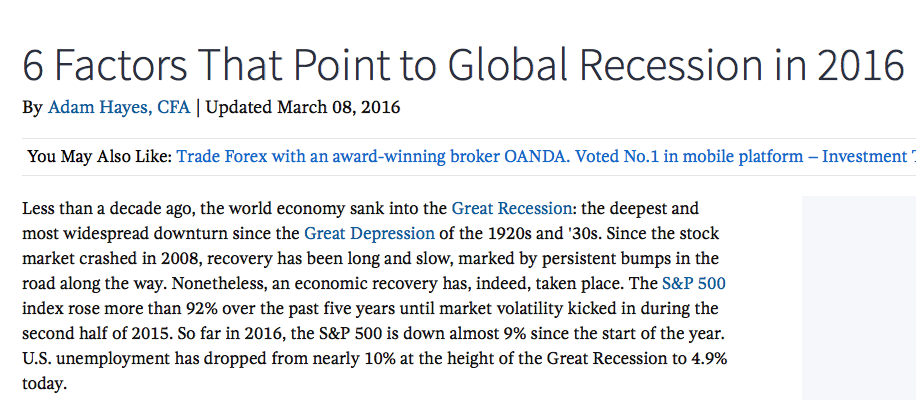
The Stock Market is Grinding its Way Back

But I’m not ready to switch to the dark side yet. Yes, there was a disturbance in the force earlier this year with our own stock market falling 1,000 points in the first two weeks of January. But all of the financial indices have been working their way back to their highest levels before the January meltdown.

The S&P 500 index is only 75 points (or 3.5 percent) from it’s all time record high.

Car Buying Still Remains Impressive

US Monthly Indicators-D.xls
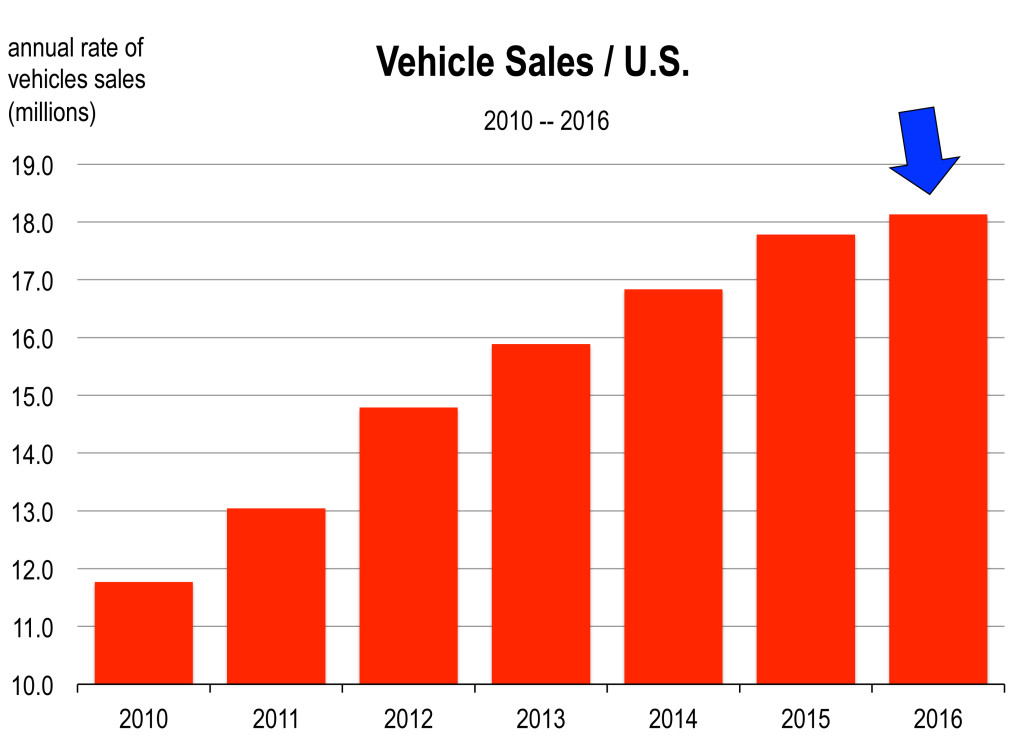
Americans are buying more cars at a near record pace. There are more vehicles on the road than ever before and traffic remains tough. The seasonally adjusted annualized pace of 17.5 million units in February was the strongest in 15 years. All the gains over the past year have been in the light truck segment thanks to persistently low gasoline prices.

New Home Sales are Clawing Their Way Upward

New-home supply reached its highest level since late 2009 in February but remains tighter than historical standards. Furthermore, the inventory-to-sales ratio held steady at 5.6 months but is still up nearly 25% over the year. This is nationwide inventory. It’s only 3.5 months in California and not generally rising.

Despite the past several months of decline, the NAHB Housing Market Index is near its highest level since 2006 and indicates that homebuilders feel confident about future construction activity. Sure enough, housing starts increased 5.2 percent between January and February and are 31% higher than in February 2015.

The Labor Market Continues to Improve at a Steady Pace

Job creation exceeded 200,000 again in March, the 6th consecutive month that gains were above that threshold. The pace is sufficient to tighten the labor market. Consequently, worker recruitment is becoming much more difficult and average hourly earnings are rising faster. The unemployment rate is 5.0 percent.

Employment growth is clocking in at a healthy pace, and wage growth has started to accelerate, providing more incentive to potential homebuyers still waiting on the sidelines. In addition, despite expected tighter monetary policy over the next few years, mortgage rates remain at rock bottom, and this should encourage greater housing demand over time.

US Monthly Indicators-D.xls
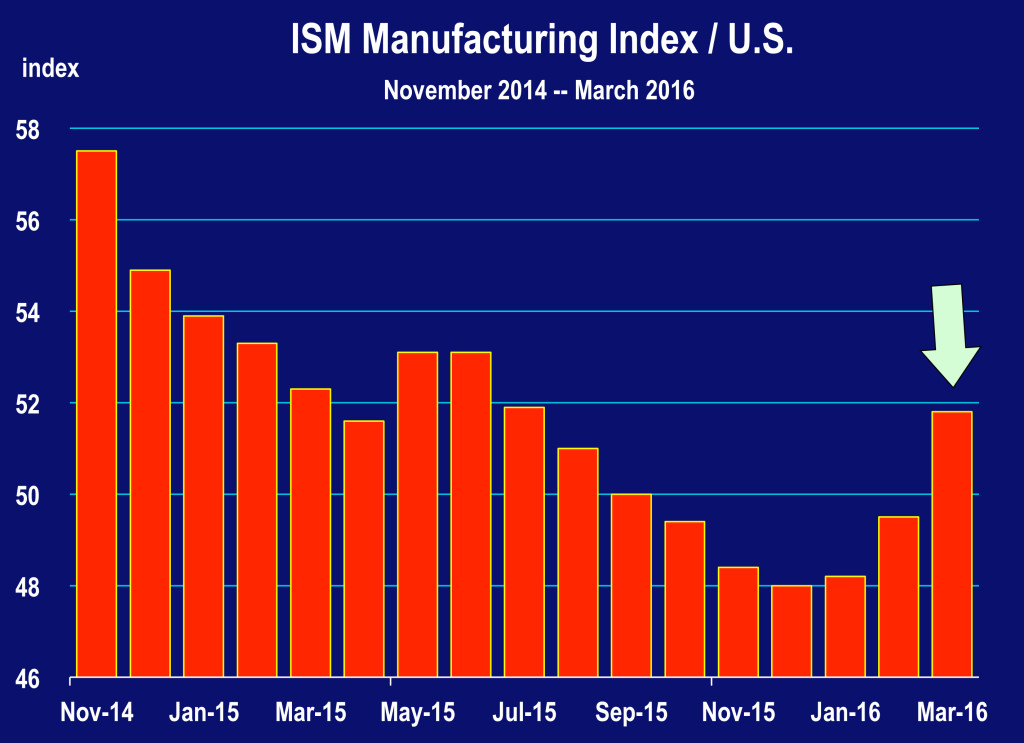
Manufacturing Rising Again

It seems that the U.S. industrial sector is showing clearer signs of a rebound. The manufacturing index, which has largely been in decline since last July, posted two consecutive months of expansion in February and March of this year. New orders for goods rose sharply in March, recording the largest monthly gain since 2009.

No Recession

We are just about at the 7 year anniversary of the end of the Great Recession. By mid-summer we will be in the 8th year of an economic recovery/expansion. And while the up part of the business cycle does not normally last more than 8 or 9 years, we might actually be able to extend growth out for an indefinite period. After all, the first 3 or 4 years of the economic recovery were so weak that few people were convinced that the recession had ended. So one might argue that we are “owed” a few more years of positive economic growth.

US Monthly Indicators-D.xls
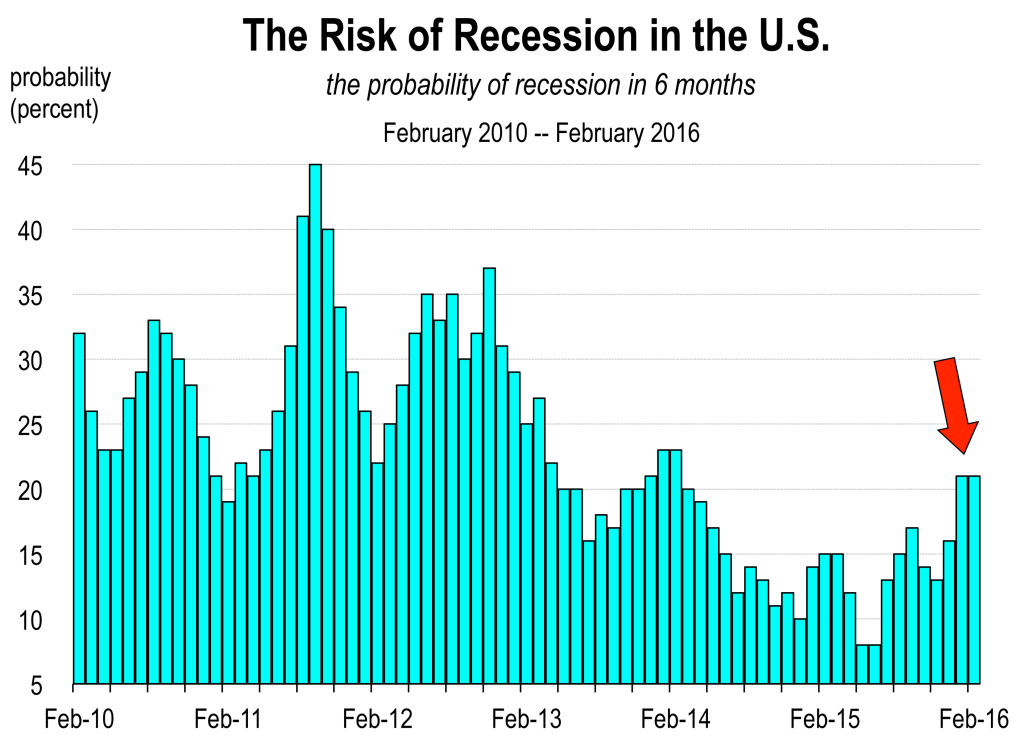
A higher stock market leads to more spending by consumers because of the wealth effect. Retail sales, which have been dragged lower in recent months by falling gasoline prices, should move higher going forward, especially as the U.S. economy approaches full employment and average earnings move higher.

While the risk of recession has increased from 15 percent in March of 2015 to 21 percent in February of 2016, that’s still a relatively low probability that the U.S. economy will fall into recession in six months.

So plan accordingly for another year of growth. Plan also for slightly higher interest rates, inflation, and difficulty hiring more workers. Barring a calamitous event, the demand for your product or service should not be impacted much by the general economic mood in 2016, except perhaps to the upside.

__________________________________

Upcoming Economic Forecast Conference

Orange County Economic Outlook 2016
In Partnership with the UCLA Anderson Forecast
April 28, 2016
Irvine, CA
Register Now

The California Economic Forecast is an economic consulting firm that produces commentary and analysis on the U.S. and California economies. The firm specializes in economic forecasts and economic impact studies, and is available to make timely, compelling, informative and entertaining economic presentations to large or small groups.

Urban Growth Controls: Their Unintended Impacts

by Mark Schniepp
March 2016

There are many forms of growth controls in place in California counties, particularly along the coast. And there are many shapes and sizes of these controls but all have the expressed or unexpressed purpose of restricting population growth and urban sprawl to prevent a future for a region that includes more traffic and the loss of open space.

Examples of growth controls include containing development within specified urban boundaries, building permit restrictions, development impact fees, infrastructure requirements, MS4 regulations, and mandating inclusionary housing.

While the latter requirement might not overtly limit growth, it often reduces the density of housing and it leads to higher home prices on market rate housing which effectively limits the demand for housing.

These are typically the symptomatic costs of growth controls:

Higher housing prices and higher rents. Controls limit housing, but they do not (and cannot) deny new populations from moving into the controlled region. Demand for housing often exceeds supply and prices tend to rise faster in controlled regions as opposed to regions without controls. Certainly enough, the median price of homes is rising faster in the San Francisco Bay Area and Coastal Southern California than in the Inland Empire or Central Valley.

It’s a paradox, but traffic congestion, energy consumption and air pollution frequently increase in areas with growth controls. Why? Because commuting patterns of workers are inefficiently altered when firms in the controlled region need workers but there is an absence of housing. Commuters, forced by housing prices and the lack of supply to live far from where they work, clog California highways and choke side streets during peak drive times to work.

Ventura Age 2014.xlsAn exodus of big employers. Almost every business and government agency that remains in the controlled region struggles with recruiting and retaining workers who cannot afford to live nearby. Firms end up defecting from the region or downsizing and opening operations in uncontrolled areas where access to a larger labor force (and more available and affordable housing) is less challenging.

Altered communities. Poorer families are often forced to double- and triple-up in rental housing. Unable to buy homes, many middle-class families with children move away. We have observed this particularly disturbing phenomenon occur in Southern Santa Barbara County and Ventura County.

Other adjacent regions are impacted. Firms move to adjacent areas and workers move to adjacent areas where housing is more available and more affordable. The result is a downsizing economy in the controlled area, leading to lower economic growth, less prosperity, fewer jobs and high home prices. There will be fewer services offered to the resident population. This might be fine for the retired couple or individual, but it’s problematic for working households.

These are the unintended consequences of growth policies. The intended consequences of growth controls: less population, less housing, and more open space are realized, but at a cost that includes fewer jobs, a smaller middle class, expensive housing, fewer services, and more traffic on existing highways and roads.

Growth controls (SOAR) have been in effect for nearly 20 years in Ventura County and the number of vehicles traveling on interstate 101 and highway 23 are at record levels. The number of commuters to and from Ventura County to Los Angeles County is at record levels. The average commute time of workers in Thousand Oaks, Moorpark, and Simi Valley is above the state and federal average commute time and akin to workers who reside in the San Fernando Valley.

__________________________________

Upcoming Economic Forecast Conference

Orange County Economic Outlook 2016
In Partnership with the UCLA Anderson Forecast
April 28, 2016
Irvine, CA
Register Now

The California Economic Forecast is an economic consulting firm that produces commentary and analysis on the U.S. and California economies. The firm specializes in economic forecasts and economic impact studies, and is available to make timely, compelling, informative and entertaining economic presentations to large or small groups.

The Recent Stock Market Collapse: Is Another Recession Looming?

by Mark Schniepp
February 2016

Sorting Out the Stock Market Collapse . . .

Stock_Market.xls
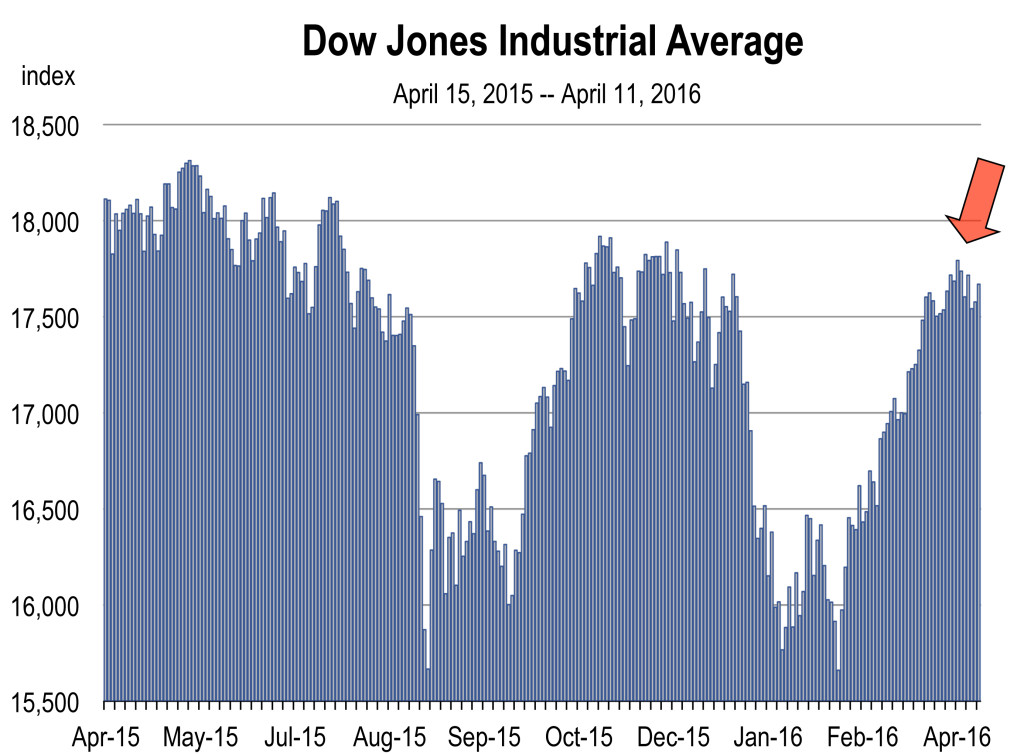
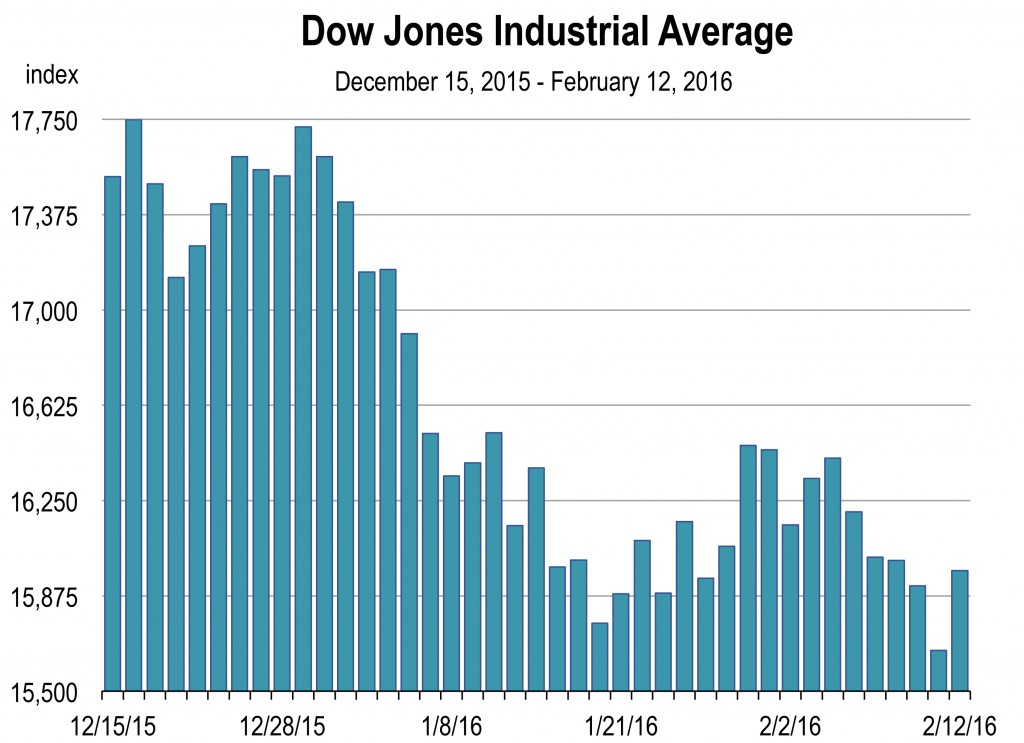
OK, the market is now down 10 percent from where it stood at the turn of the year. This is a repeat of what happened in August. Why? Is this the early warning signs of the next recession?

No.

The stock market is responding to the other collapse, like oil prices. And this is largely due to the slowing economy of China. But there’s more to it than just that.

Crude Oil Supply and Demand Fundamentals

Today it costs under $30 to buy a barrel of oil—the lowest level in 12 years. As recent as June 2014, the price of a barrel of oil was $108. What has caused oil prices to plummet?

There has been steady production from the OPEC countries, increased production from the United States, and declining demand from China. Between July 2014 and July 2015, U.S. weekly production increased by over 1 million barrels of oil.

Normally, OPEC would have reduced its production quotas to push oil prices higher but throughout 2015 they did nothing and the largest producing member of OPEC, Saudi Arabia, has kept its production at late 2014 levels. The world is now at an all time record high in oil production and the price has fallen to $29.75 as of February 12, 2016.

Total_World_Oil_supply.xls
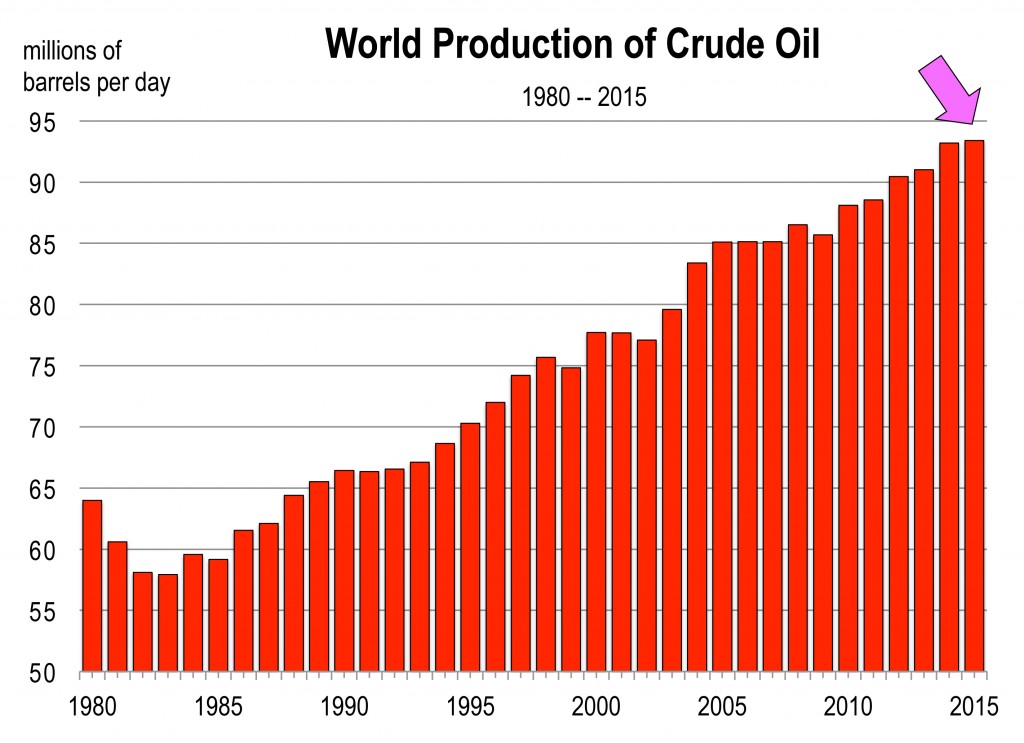
The oil price collapse is due simply to increased supply (mostly by the U.S.) and decreased demand forces. Demand for oil globally began tapering off, driven most importantly by a slowdown in China’s economy. Until 2010, China had maintained an average growth rate of more than 10 percent annually for over 30 years. This high growth scenario started to slow in 2010. Currently (2016) the current GDP growth target set out by Chinese authorities is 7 percent, and many have questioned how much further growth could slow in the second largest economy in the world.

So why are low oil prices affecting the financial markets? Cheap oil means cheap gasoline. So shouldn’t that generally help consumer spending and the domestic economy?

Ultimately, it will. But in the short term the decline in oil is damaging oil related industry stock prices. You see, oil prices and stock prices are positively correlated.

Furthermore, lower oil prices also cancel plans for capital spending. It is estimated that a decline in energy-related investment such as new drilling equipment has more of an impact than consumer savings. And equity prices usually rise with increased business spending, offsetting the positive effects on savings for the consumer.

Finally, though only 6 percent of the S&P 500 companies are directly exposed to energy, other sectors including industrials also affect the index, and they are impacted by oil prices.

02-2016 Gasoline price

The average price in California is now down to $2.41 per gallon. However, the average for the entire nation is $1.70. In Kansas City, it’s $1.32. Prices are down 24 cents from last month and 55 cents from a year ago.

China

02-2016 Red China Image
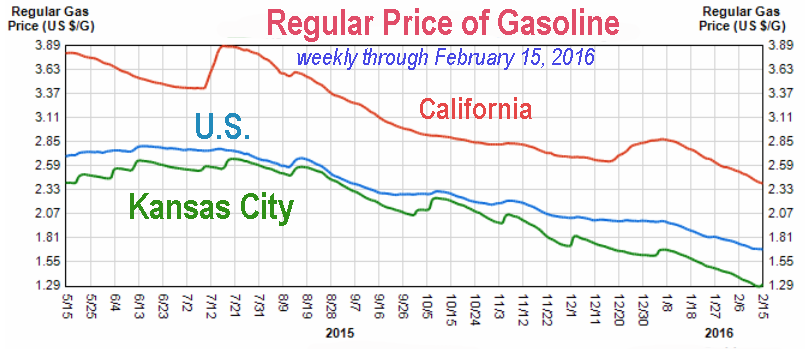
The Chinese stock market is now in a bear market for the second time in 7 months. And U.S. investors are interpreting China’s problems as poison for the U.S. Why?

Well, because China has been an important source of global growth with significant spending power. China does carry some clout, being the second-largest economy in the world.

Second, there is an important psychological effect in the markets, especially as China is a big purchaser of U.S. treasuries and a big force in global currency markets.

Furthermore, a lack of clarity on the true health of China’s economy has added to recent market volatility. Investors don’t really know how strong or weak the underlying Chinese economy is. And a weaker yuan heightens worries that the slowdown in China’s economy is deeper than the official data suggests.

The underlying Chinese economy may not be robust enough to reach the 7 percent target set by the government for 2016. Growth is already down from 10 the percent growth reached over the last decade.

Meanwhile, just as China had been devaluing the yuan, it is now selling U.S. Treasuries to prop up its currency, which could put upward pressure on U.S. interest rates.

Uncertainty Over the Fed

I’ll address this more next time, but for now, what the Fed will do is an issue for the stock market because investors are concerned that the U.S. economy is not yet ready for additional rate increases throughout 2016.

Fed Chair Janet Yellen did emphasize during the December press conference that the committee’s decision will remain dependent on incoming economic data going forward. While some data has continued to improve (like the unemployment rate) there is worry about the domestic manufacturing sector, how long technology can keep fueling the U.S. economy, and the international setting including Europe and China.

__________________________________

Upcoming Economic Forecast Conference

Our next conference is scheduled for March 10, 2016 in Santa Clarita, California. We are speaking at the Santa Clarita Valley Economic Development Corporation’s annual Economic Forecast. The venue is the Hyatt Valencia. The time is 2 PM to 5 PM.

Register Now

The California Economic Forecast is an economic consulting firm that produces commentary and analysis on the U.S. and California economies. The firm specializes in economic forecasts and economic impact studies, and is available to make timely, compelling, informative and entertaining economic presentations to large or small groups.

The Year Ahead

by Mark Schniepp
January 2016

The Year Ahead
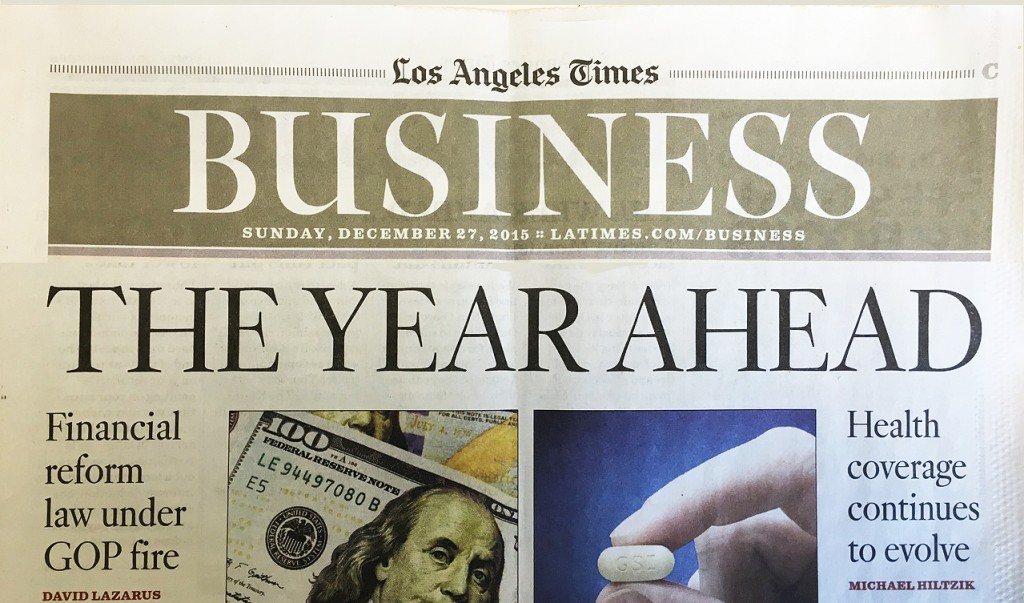
Source: LA Times, December 27, 2015, page C1
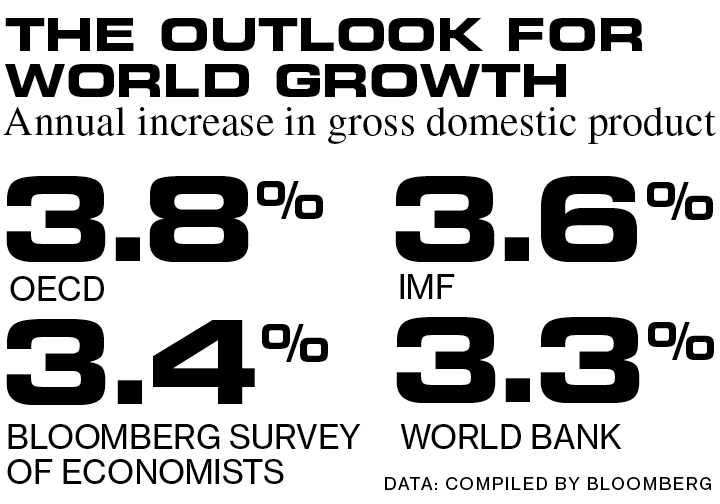
What you should know about 2016

Because world economic events have so much more influence on our own domestic growth, job creation, and the rise in income, monitoring the outlook for the principal economies in the world is a critical factor in predicting the probable performance of the U.S. economy in 2016.

The Panama Canal will be wider when a third set of locks opens in April. Ships twice the size of what traverse the canal today will be accommodated. U.S. Ports are now gearing up for the traffic. Will there be enough global demand to fill the canal this year?

Keep in mind that the presidential election occurs on November 8, 2016. There are also major elections in Japan, Germany, the United Kingdom, and China this year.

The Summer Olympics in Rio de Janeiro, Brazil begin on August 5th.

The United Kingdom votes on a referendum in October on whether to remain in the European Union. Leaving would free the U.K. to purse it’s own trade deals with faster growing economies than the sluggish European economy presently. It would also impose tariffs on 90 percent of its exports to the existing European Union. Staying gives the U.K. open access to the broader European market of 500 million people.

World economic growth is projected to be 3.5 percent in 2016, an improvement from the 3.0 percent recorded in 2015.[1] Other sources put world economic growth at 2.7 percent for 2016, stating that “2016 will be another year of repair, recovery, reform and risk for most countries.[2]

This latter view is supported by China’s sinking GDP growth, which will continue to decelerate. Consequently, global demand for goods and materials will remain soft. We therefore expect interest rates to remain low (despite the threat of tighter monetary policy by the Federal Reserve) along with the prices of oil and other commodities. World inflation will be less than 2.0 percent, and probably closer to one percent in Europe and Japan.

bloomberg_2016Source: Bloomberg

Bad weather is predicted around the Pacific Rim due to the strong El Nino that is present today. This could mean major disruptions from storms and floods. Major disruptions tend to produce sell-offs in world financial markets. The California coastline is also vulnerable to some degree of carnage this winter.

The U.S. economy will have very low unemployment and very low inflation in 2016. And while we have been predicting higher wage and salary growth this year, it’s not likely to accelerate beyond an average of about 3 percent.

American families have paid off debt since the Great Recession, and there is pent-up demand, particularly for housing. As millennials move out of their bedrooms at their parent’s homes, the housing market will be impacted. For now, it’s the apartment market with vacancy rates throughout the nation falling to record lows. Over the next 5 years, it will be the first time home buyer market. Interest rates will be a determining factor as to how robust the housing market will be in coming years.

Few economists expect a major slowdown in 2016, let alone a recession. There’s little reason to think the conventional wisdom is wrong this time around. The question is whether 2016 will be a true turning point in the world economy and the best year of the current economic cycle.

Risks in 2016

Most of the risks lie with the international economy, with the largest uncertainty resting on China and Europe.

For U.S. exports to contribute positively to overall domestic growth, both China and Europe need to be healthy. And for Europe to avoid risk of a further slowdown, emerging market growth needs to improve. Historically emerging market nations have been important for European exports. Weakness in these markets would produce more than proportional downside risks to the world economy.

Emerging GDP forecast
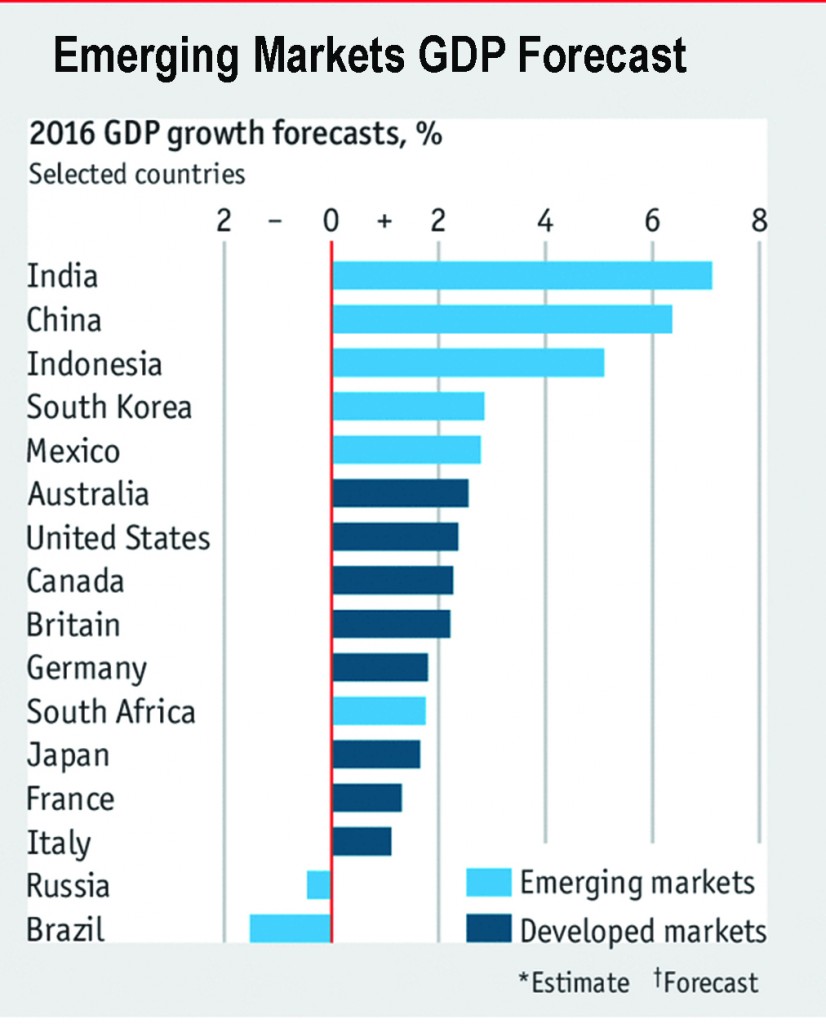
Source: Economist Intelligence Unit, The Economist, December 30, 2015

Backed by lower oil prices, a weaker euro, and quantitative easing by the European Central Bank, Europe’s GDP growth is expected to reach 1.5 percent with inflation of around 1 percent during the year.

If European and global markets remain calm, Europe will continue its recovery. But any of a number of shocks, whether a hard landing in China, debt problems in Europe, El Nino disruptions, or terrorist disruptions, will create substantial pressure on policymakers at a time when the constraints on their ability to act are already intense.


[1] The International Monetary Fund, the World Bank, and Bloomberg, November 2015.
[2] The Economist Economic Intelligence Unit, December 30, 2015.

__________________________________

Upcoming Economic Forecast Conferences in 2016

2016 Ventura County
February 5, 2016
Westlake Hyatt
Register Now

2016 Santa Clarita Valley
March 10, 2016
Valencia Hyatt
Register Now

2016 Orange County (In Partnership with the UCLA Anderson Forecast)
April 2016
UC Irvine

2016 San Diego County (In Partnership with the UCLA Anderson Forecast)
Date TBD

The California Economic Forecast is an economic consulting firm that produces commentary and analysis on the U.S. and California economies. The firm specializes in economic forecasts and economic impact studies, and is available to make timely, compelling, informative and entertaining economic presentations to large or small groups.