by Mark Schniepp
April 8, 2021
With the advent of spring the U.S. economy is clearly strengthening and is further along than nearly every other big economy in the world. Nationwide, the economic recovery has gained new momentum with a collection of economic indicators recording some of their highest values since the pandemic began a year ago.
Attribute all of this to the precipitous decline in positive case counts, the complete or near-complete opening up of large states like Texas, Arizona, and Minnesota, and gradual relaxation of restrictions in other states.
The stock market remains at or near record levels of valuation. The S&P 500 index set another record high on April 8, 2021. The Nasdaq is only 200 points from it’s all time record high.
Consumer perceptions of their job and income prospects this year have now risen to their highest level in 13 months. As confidence rises, this normally also leads to increased spending and job opportunities.
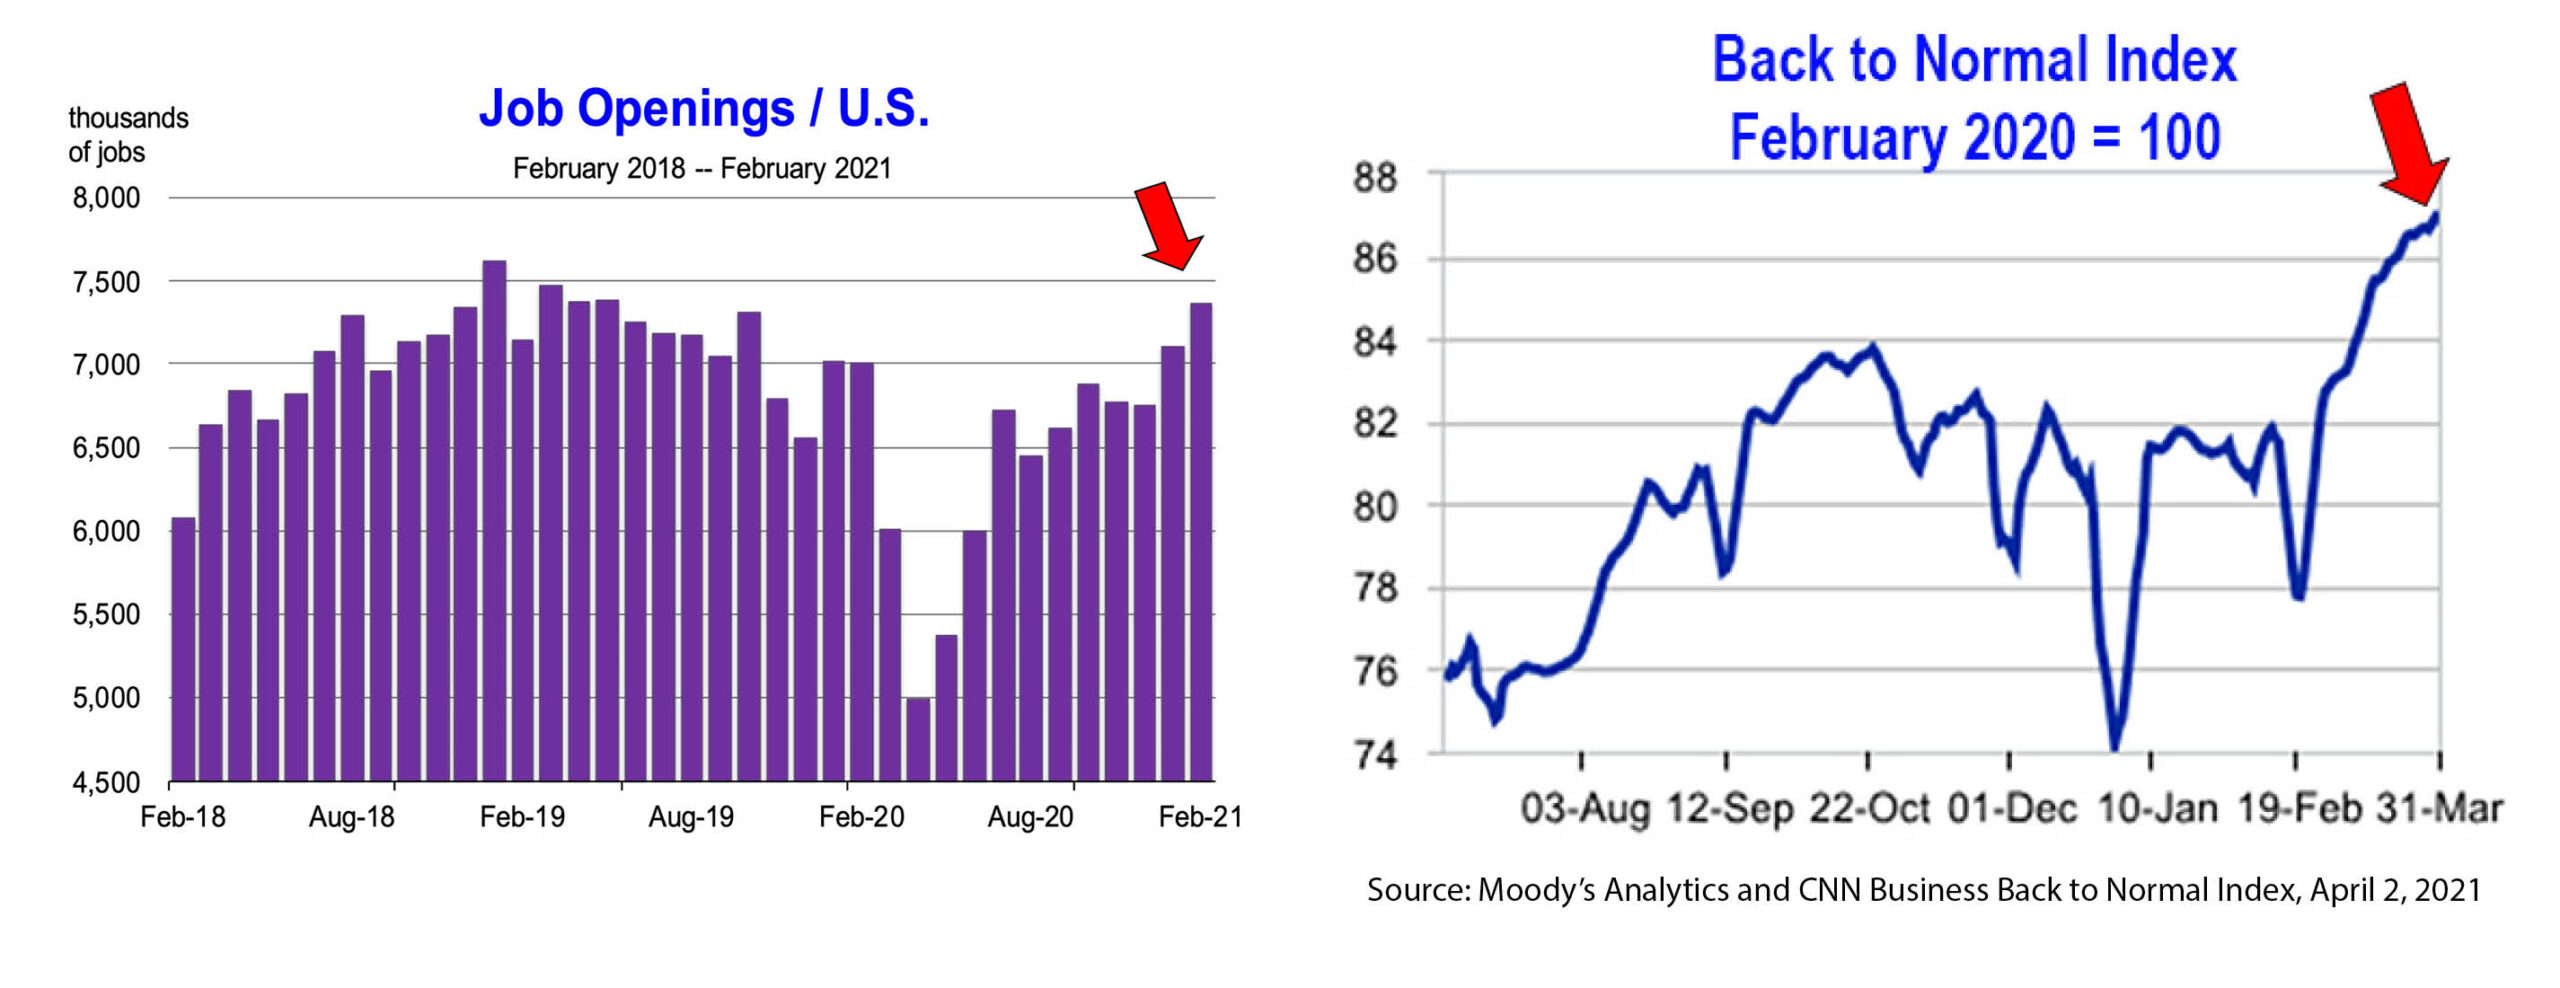
Sure enough, job openings increased to their highest level in two years and the sales of vehicles soared in March, to the highest level since 2017.
Manufacturing surged in March, to it’s highest level since the 1980s!
Loosening COVID-19 restrictions on the economy unleased 916,000 new jobs in March. Rapidly then, the labor market is bouncing back and this indicator alone will give way to substantial increases in new spending, accelerating general economic growth.
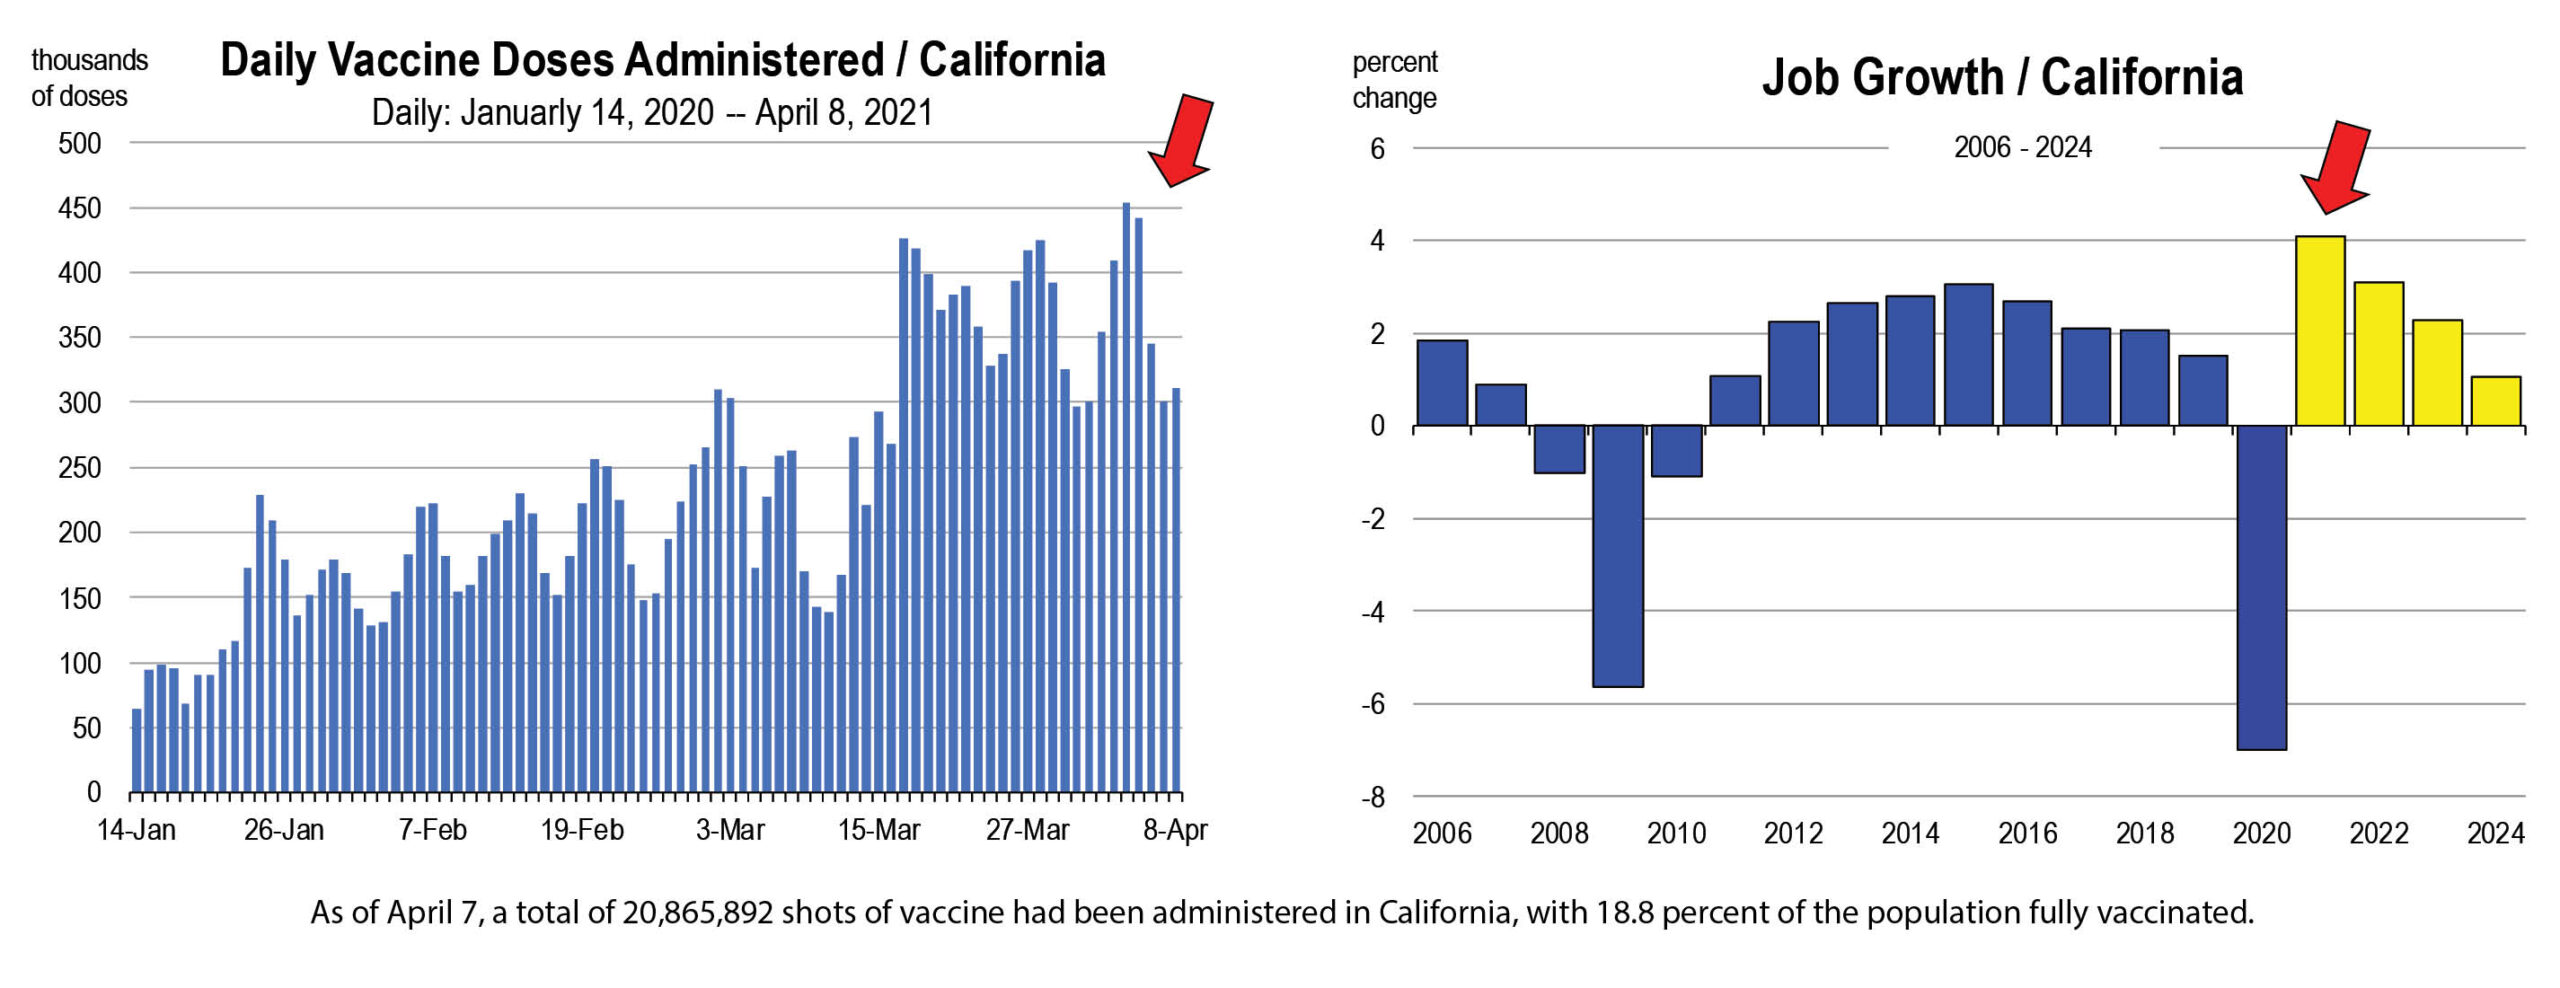
This is an important lesson for California; we’ll also see a surge in the restoration of pre-pandemic job counts as (1) more counties are allowed to open this spring, and (2) as the state entirely reopens by mid-June.
Moody’s produces a “back to normal” index every week. The latest week shows a significant rebound in people’s perceptions of the economy advancing back to “normal,” or what economic conditions were like in February of 2020. The index includes seated diner volume, passengers at airports, people moving around, and time spent at the workplace (rather than at home).
What We NOW Know About the Economy
We have come to understand much more about the U.S. and California economies that we were skeptical about or could not have predicted (1) when the pandemic began in late March 2020 or (2) even as recent as October 2020. This is important because it explains to us and to you why the outlook will be much better than originally predicted this year.
We did not know that . . .
. . . total wage and salary worker income would not be severely impacted by the deep recession, largely because the highest paying jobs and professions were not as impacted.
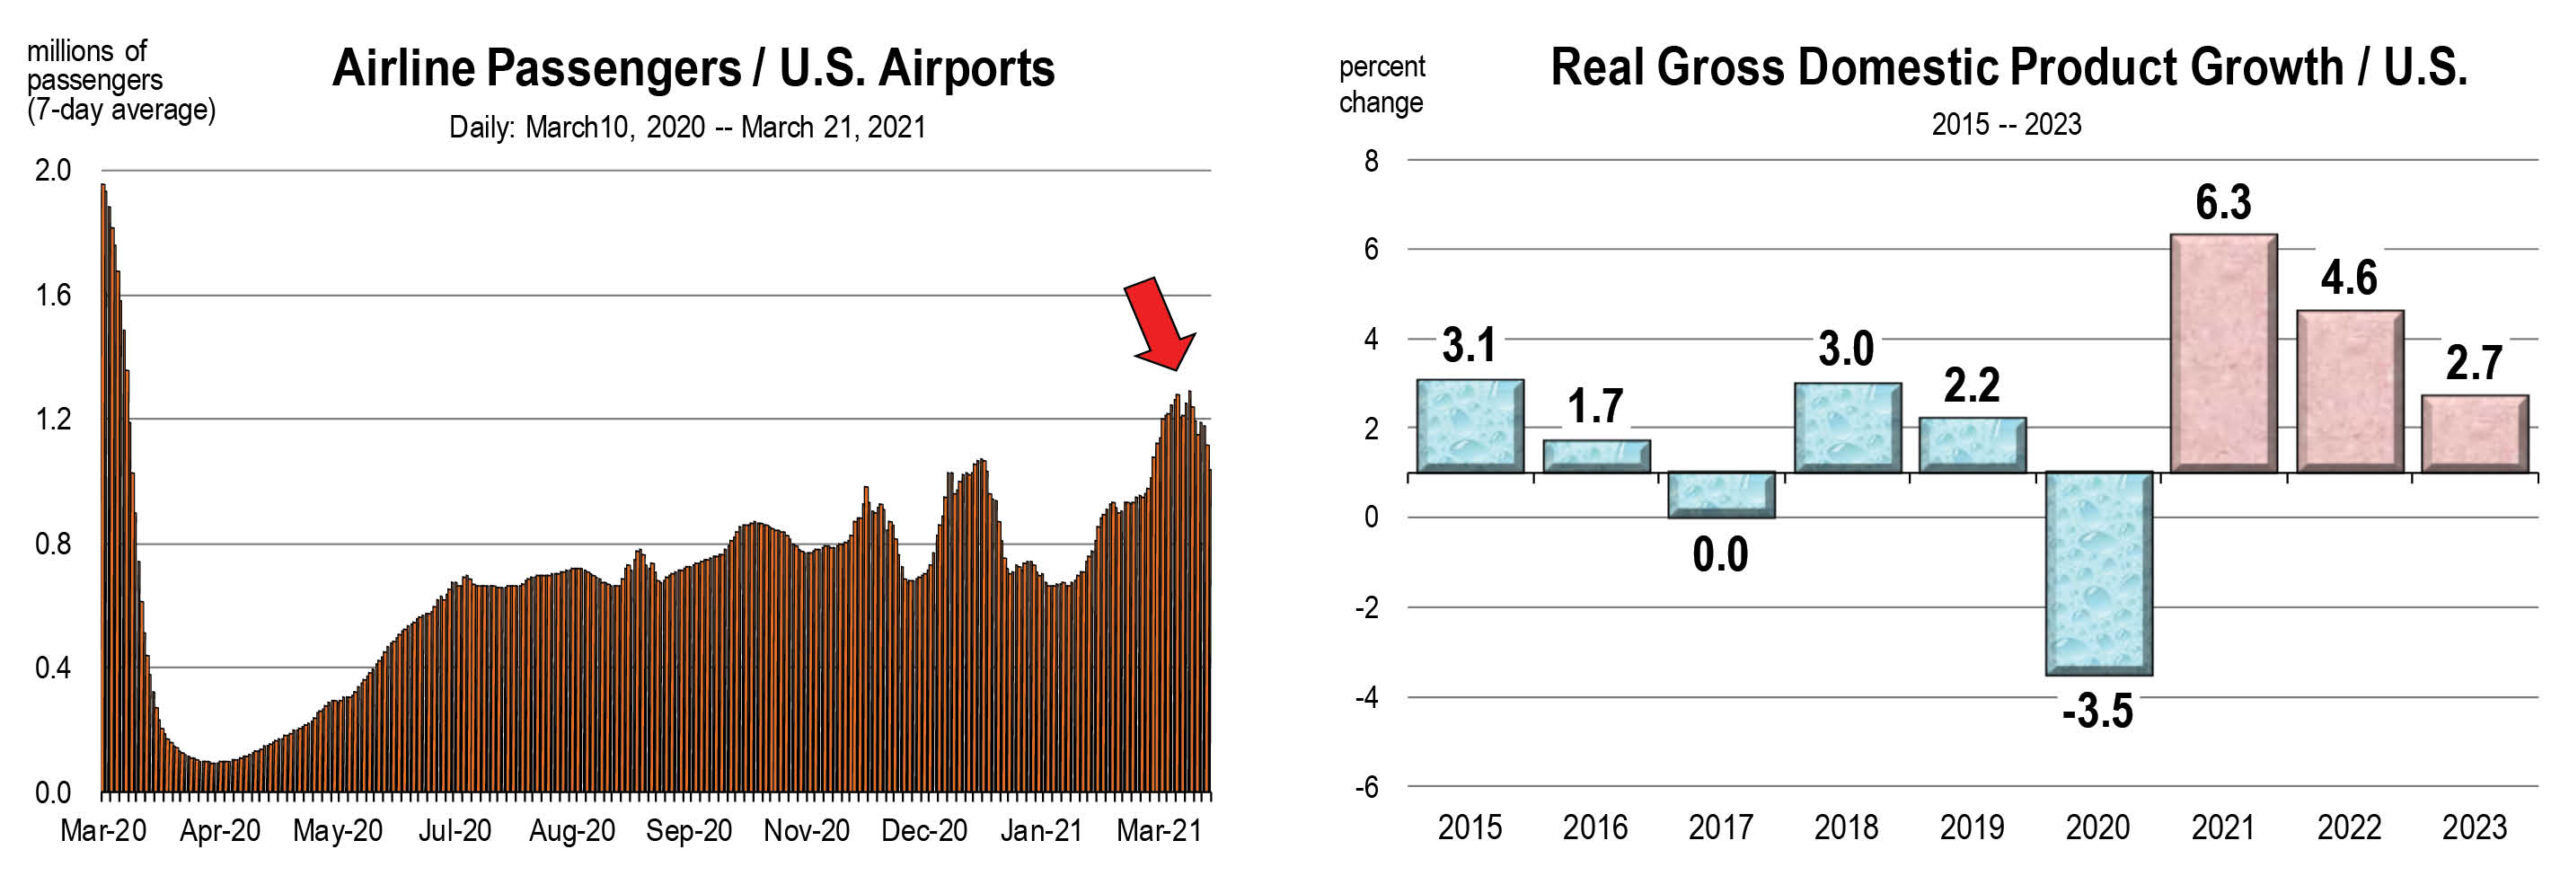
. . . consumers would increasingly become more willing to travel and dine out, though not quite yet at the pre-pandemic pace. We do see a steadily rising number of shoppers, visits to restaurants and salons, gatherings in groups, and travel through airports. It also appears that daily car trips have returned to pre-pandemic levels. Have you noticed being tied up in traffic lately?
. . . despite the original 20, falling to 15, and then lingering to 10 million unemployed workers that have represented the ugly face of the coronavirus recession in the U.S., the economy would bounce back sharply when given the opportunity state by state.
We would never have predicted that the unemployment rate would fall to 6.0 percent a year after the draconian lockdowns all over the country that generated a near 20 percent effective unemployment rate last April. However, we also did not predict that millions of people would drop out of the labor force. If they didn’t, then the current rate of unemployment would be closer to 9 percent today in the U.S. and 11 percent in California.
In view of the momentum now recorded in 2021 and the expectations for continued progress through the year, this year’s forecast produces the fastest rate of growth since 1984.
California Reopens
On Tuesday, April 6, most of the 58 counties in the State moved into the Orange Tier, meaning that an expansion of economic freedoms will begin this week and continue through the month (providing another surge is averted).
However, Gavin Newsom announced on Tuesday of this week that by mid-June, the state will do away with the color-coded COVID-19 tier system and fully reopen the economy by lifting most restrictions.
“We are now moving beyond the blueprint,” Newsom said during a Tuesday press conference to announce the plan.” We can confidently say by June 15 that we can start to open up business as usual. The June 15 goal is contingent on a steady supply of vaccine, along with getting as many people inoculated against the virus as possible.”
Newsom said he expects 30 million people will have received at least one shot by the end of April.
So if this goes forward, then our baseline forecast of a surge in economic activity this year would not be invalidated as I have cautioned over the past 2 months in previous newsletters.
We can expect a sharp reduction in unemployment claims and the ranks of the unemployed going into May and June.
Businesses should start scheduling the return of workers to offices, consider in-person business travel and in-person meetings and conferences, and revisit expectations on product and service inventory to meet the likely expansion of growth this year.
A return to the pre-pandemic normal is still not expected until well into next year, but business conditions over the 2nd half of 2021 will represent a major change from how we have had to cope with restrictions on our activities, the way we have worked, and the limits on social and larger public gatherings. And so it will seem much closer to normal than at anytime since February 2020.
The California Economic Forecast is an economic consulting firm that produces commentary and analysis on the U.S. and California economies. The firm specializes in economic forecasts and economic impact studies, and is available to make timely, compelling, informative and entertaining economic presentations to large or small groups.
![]()
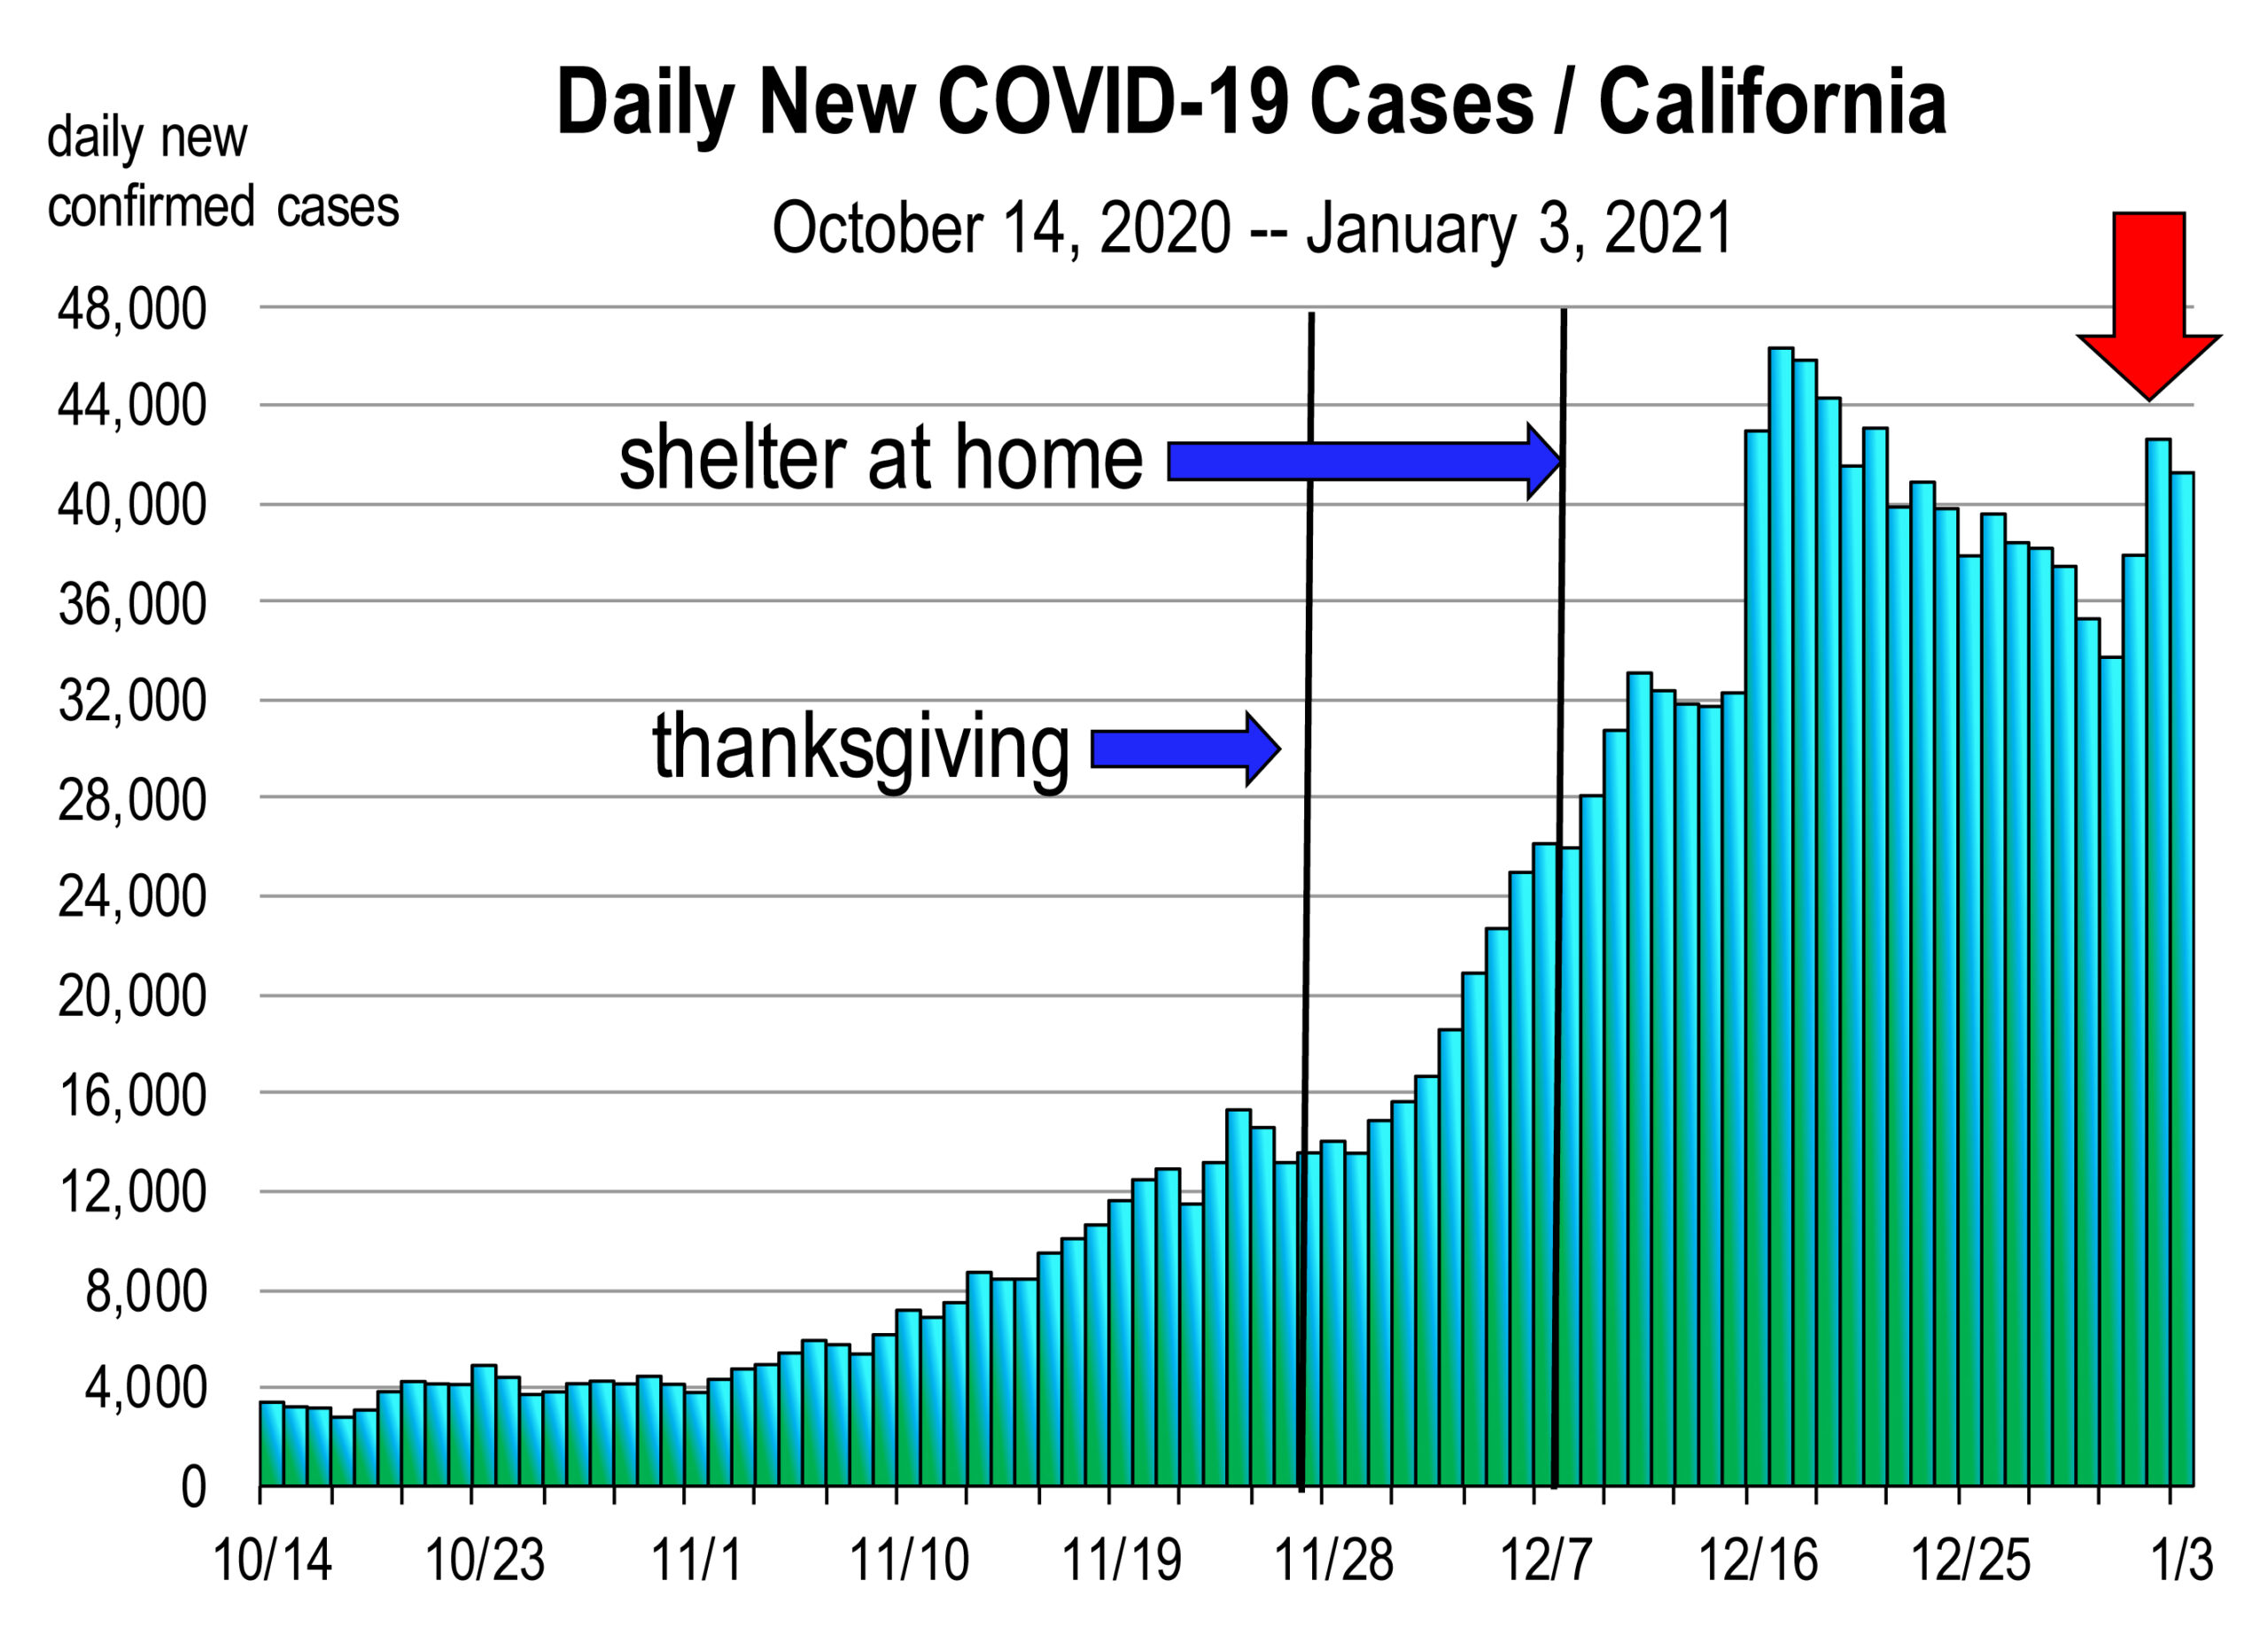
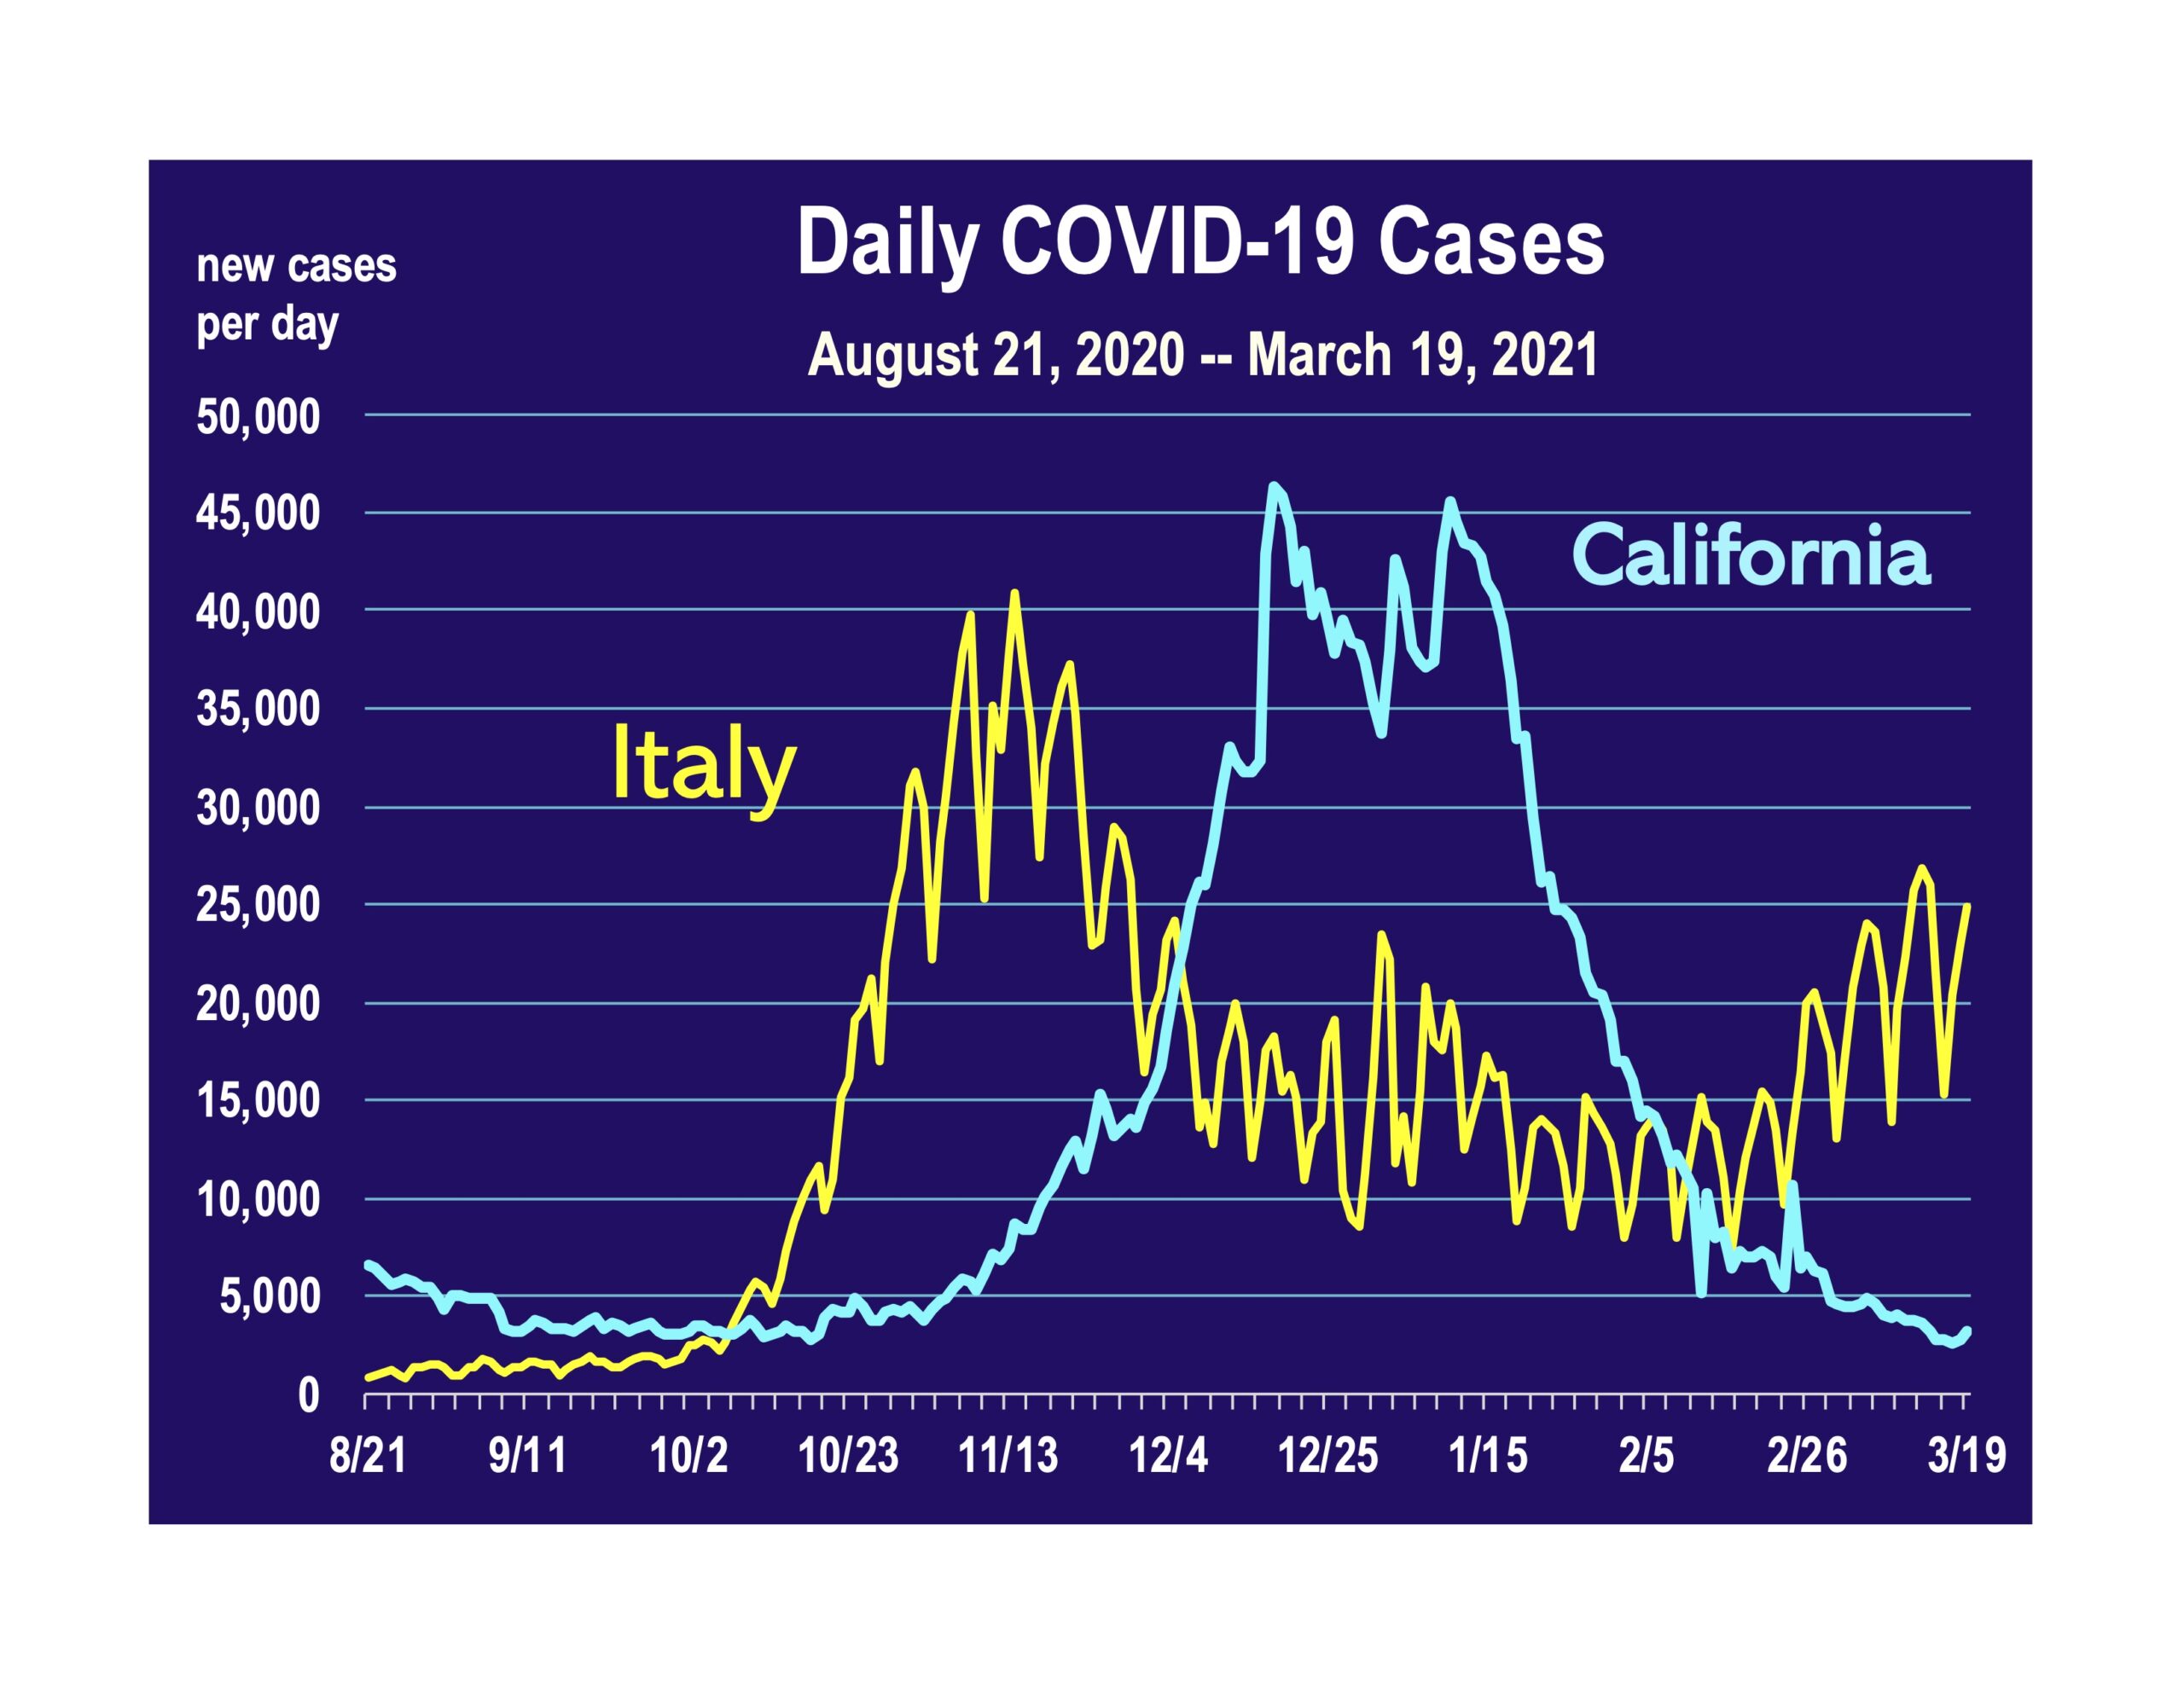 This possibility exists, and infectious disease experts from major universities in California are predicting the onset of another surge—at the end of March or beginning of April. If the European Union is a precursor to the path of the coronavirus in California, then another surge is likely, unless the vaccine can interrupt what has been a reliable predictor of past surges.
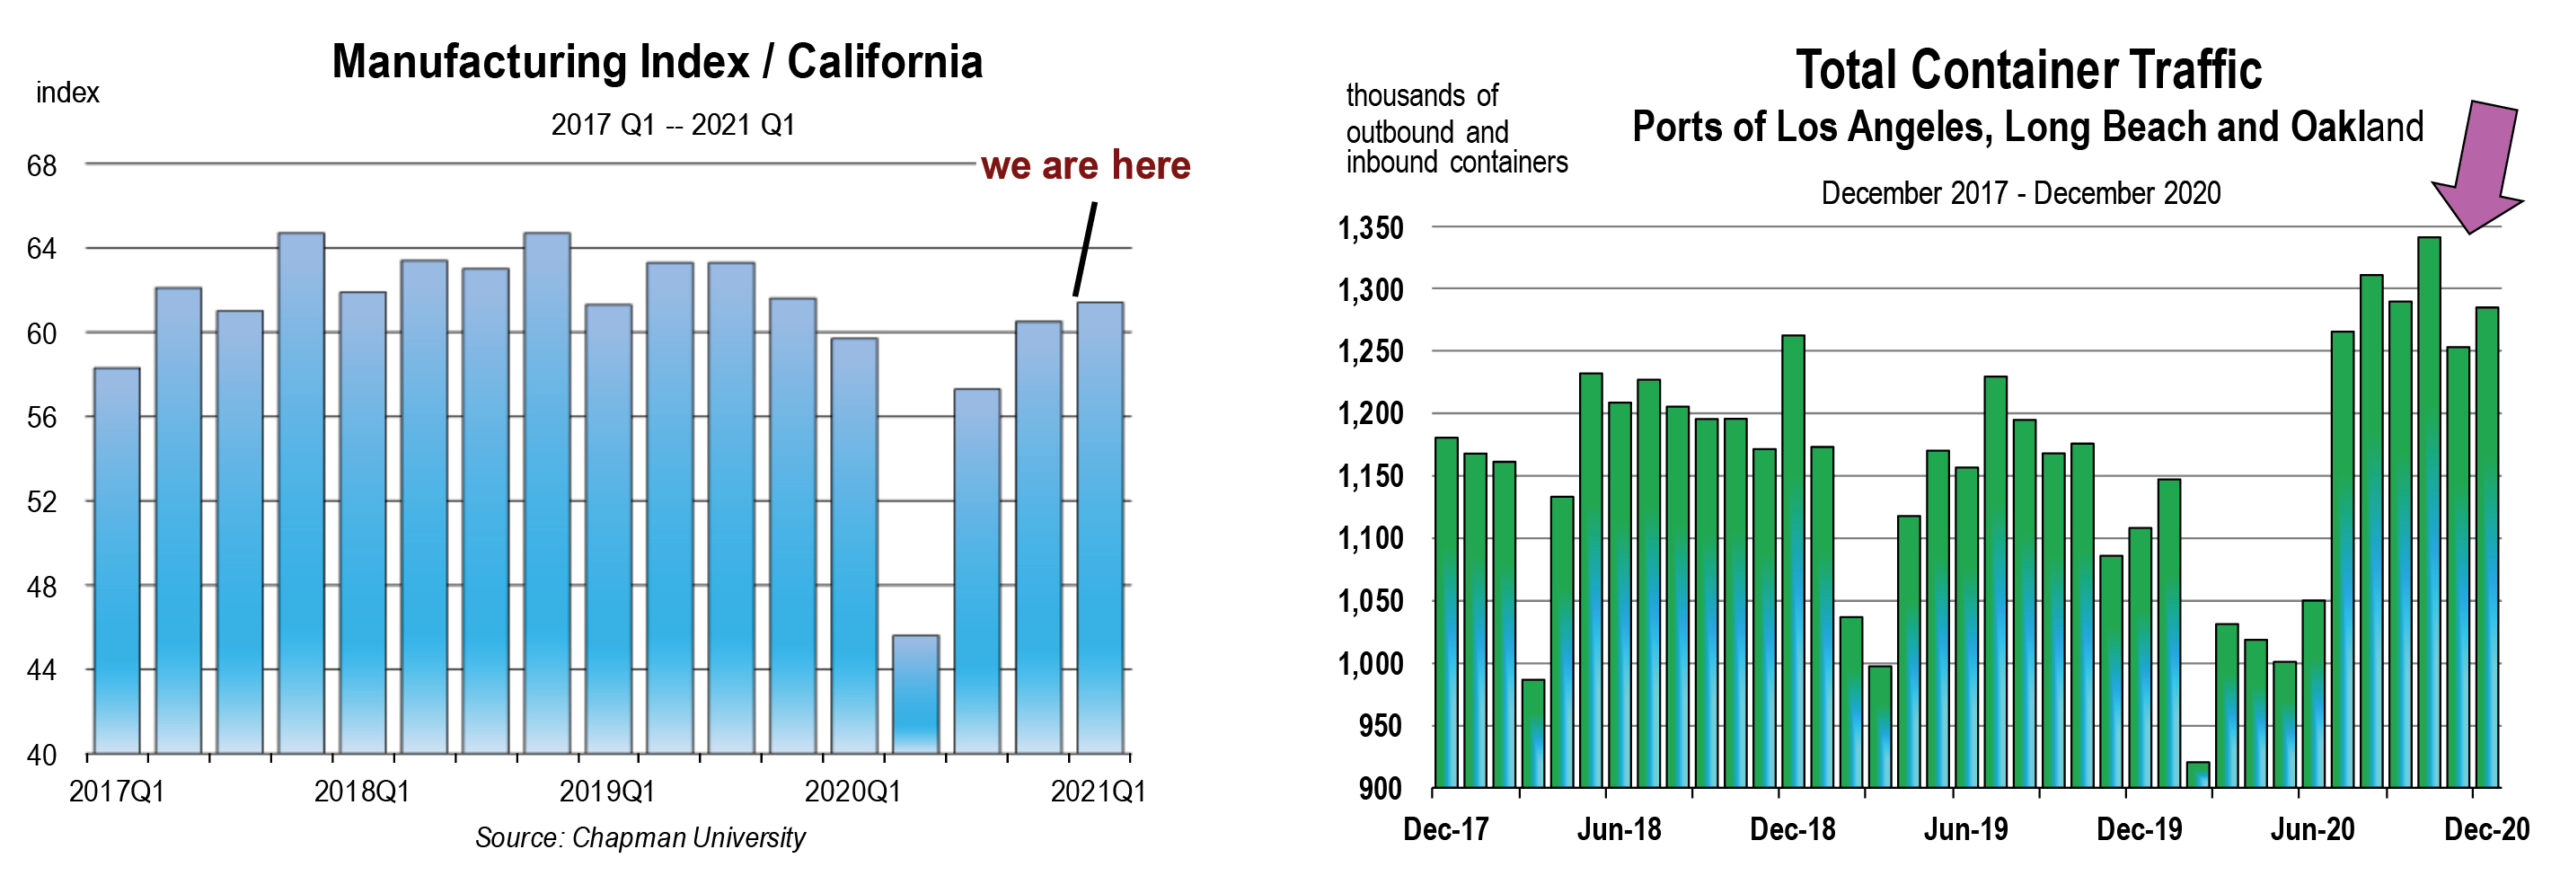
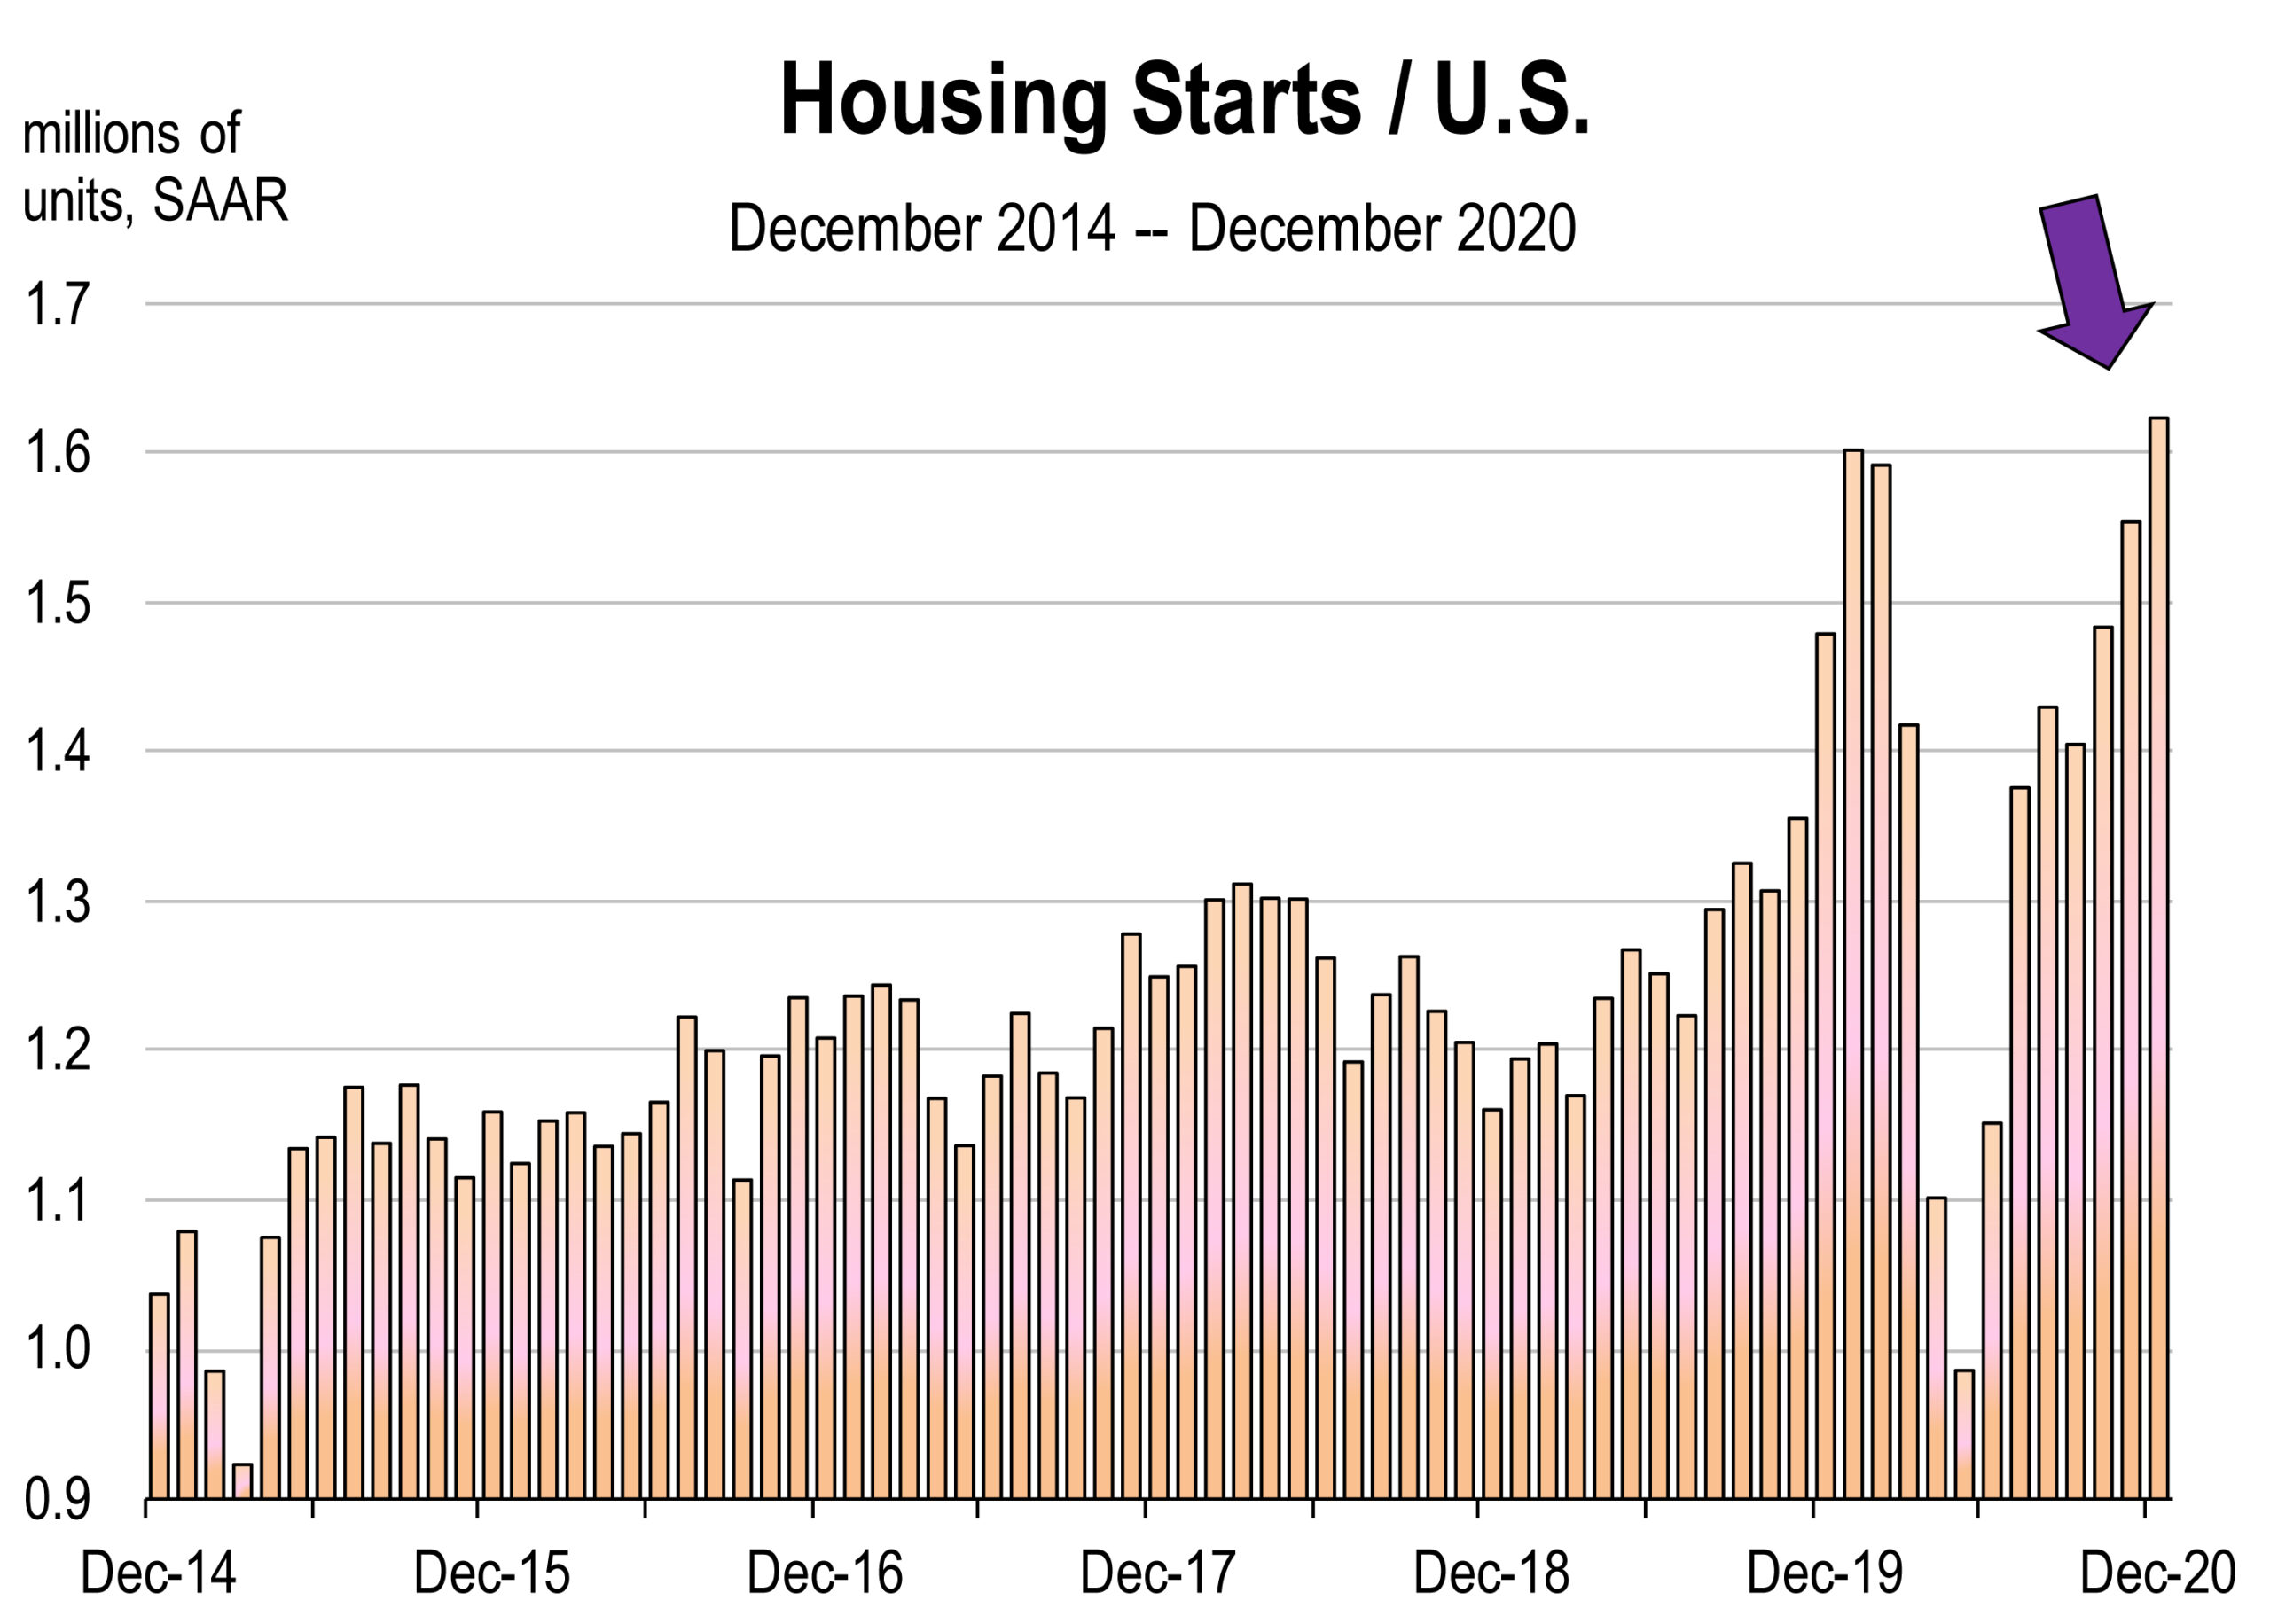 Housing is one particular indicator that is contributing largely to GDP improvement.
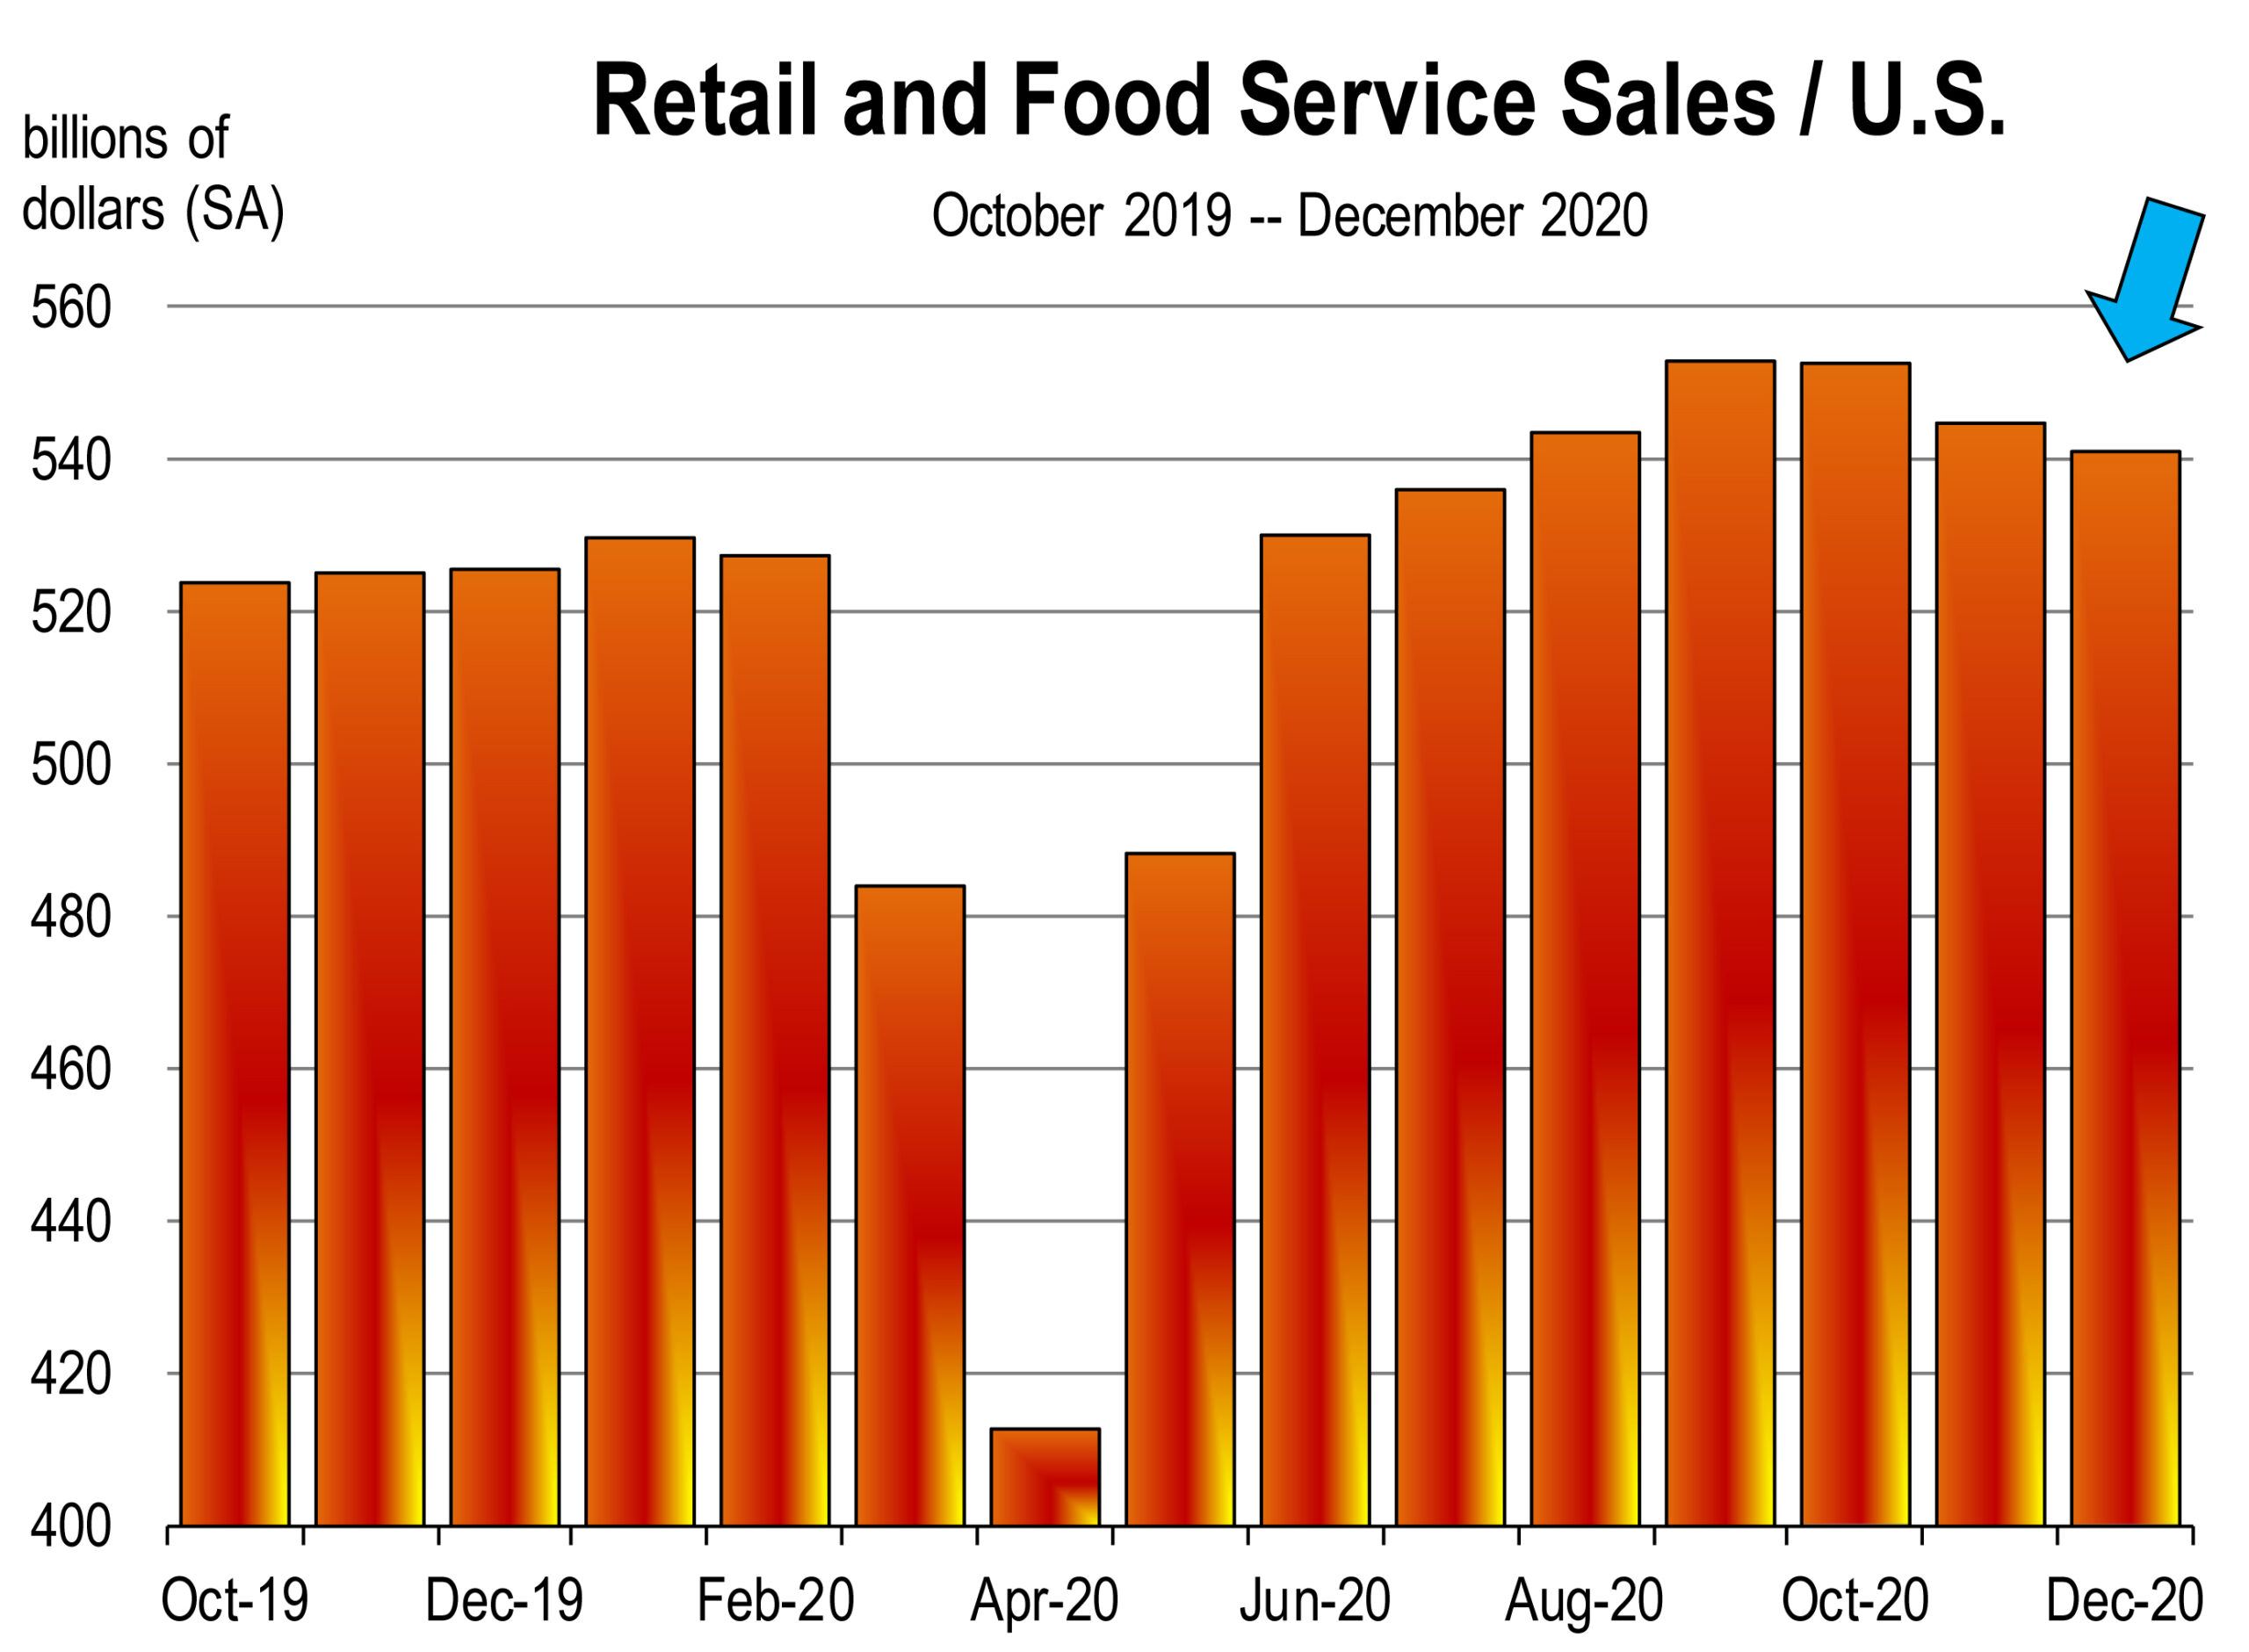 New claims for unemployment benefits have declined during the last two weeks of January. This is encouraging news although the level of claims is still extremely high. Too many American workers are still out of work. The unemployment rate is 6.7 percent. But add to that the four million people who were working a year ago but have dropped out of the labor force and are therefore not included as unemployed. Counting them would boost the nation’s unemployment rate to 9.0 percent.
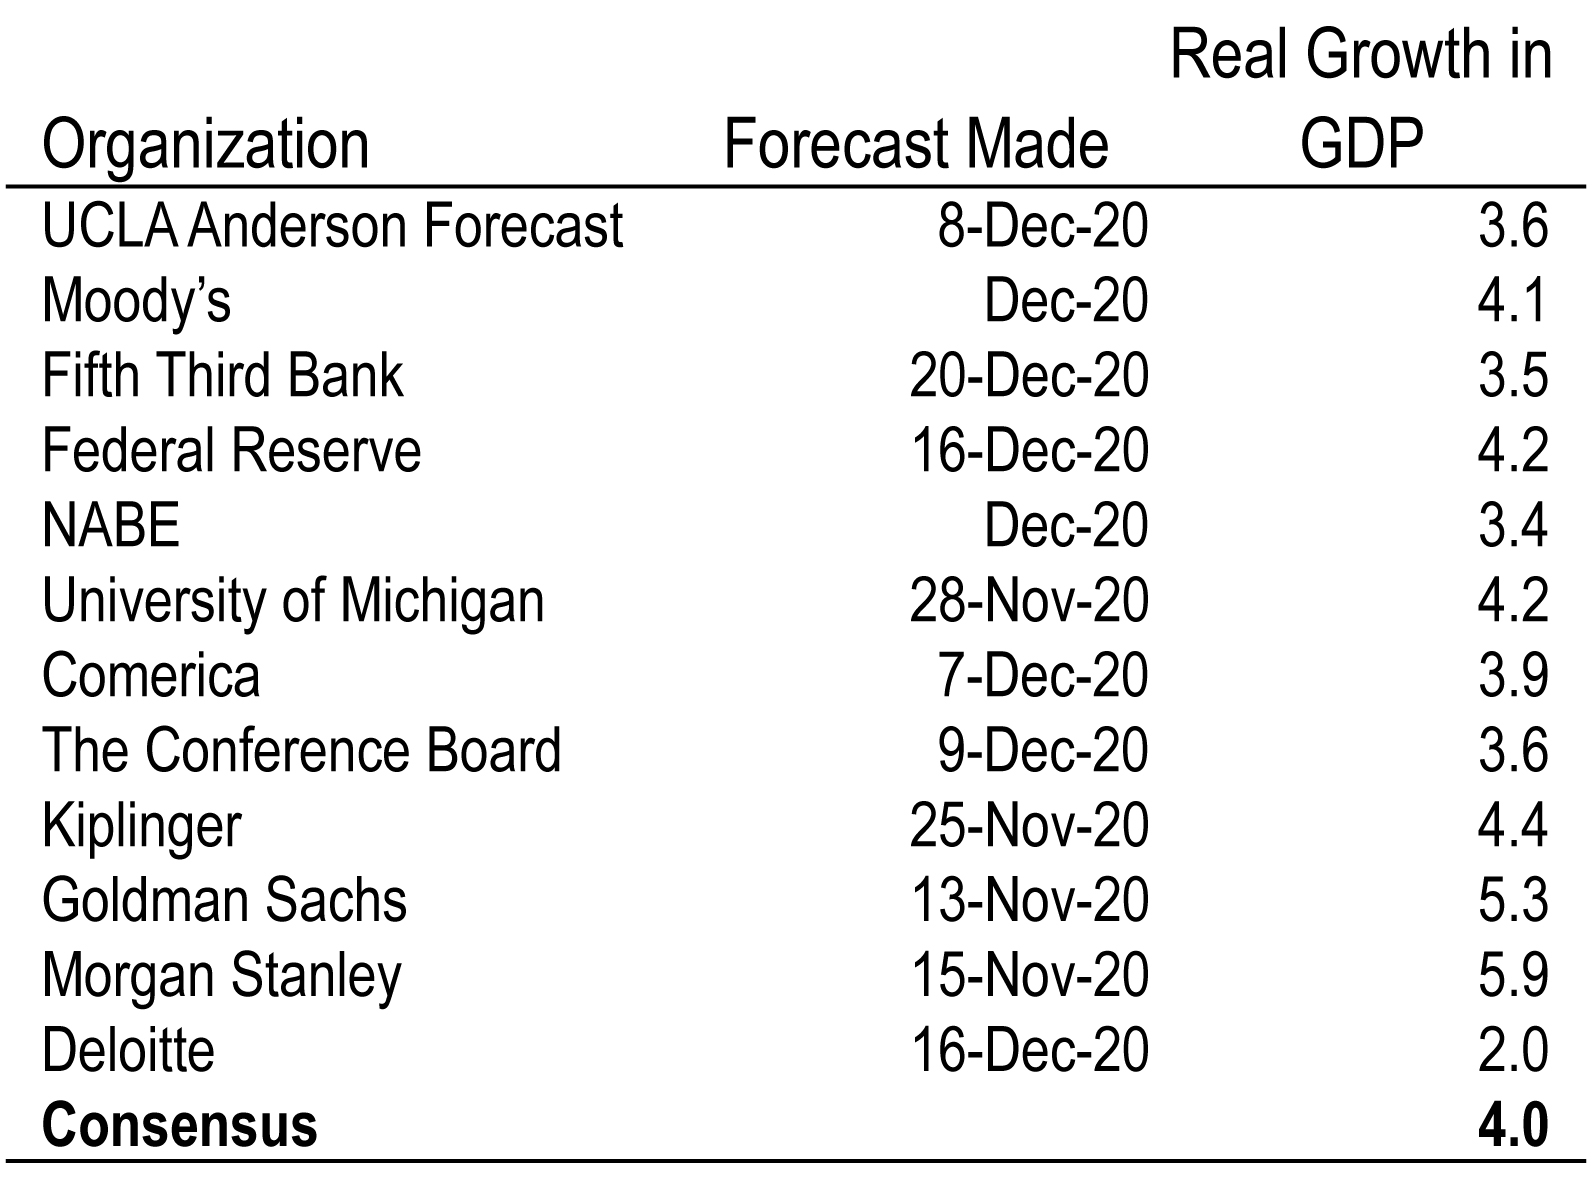 2020 is now in the rear view mirror. For the economy and for most every living person, the year was horrific. If anyone was guessing, they’d likely say that the outlook for 2021 would be better if not infinitely better, especially now that the world is being vaccinated meaning the pandemic will soon be eradicated.