by Mark Schniepp
March 2019
I mentioned this in the previous February newsletter but it’s worth exploring it further because “recession” has become a popular concern and this particular indicator has been relatively fail-safe as an antecedent for recession over the last several economic cycles. It should be noted however that most economic indicators are not signaling weakness in the economy yet.
What Does an Inverted Yield Spread Mean?
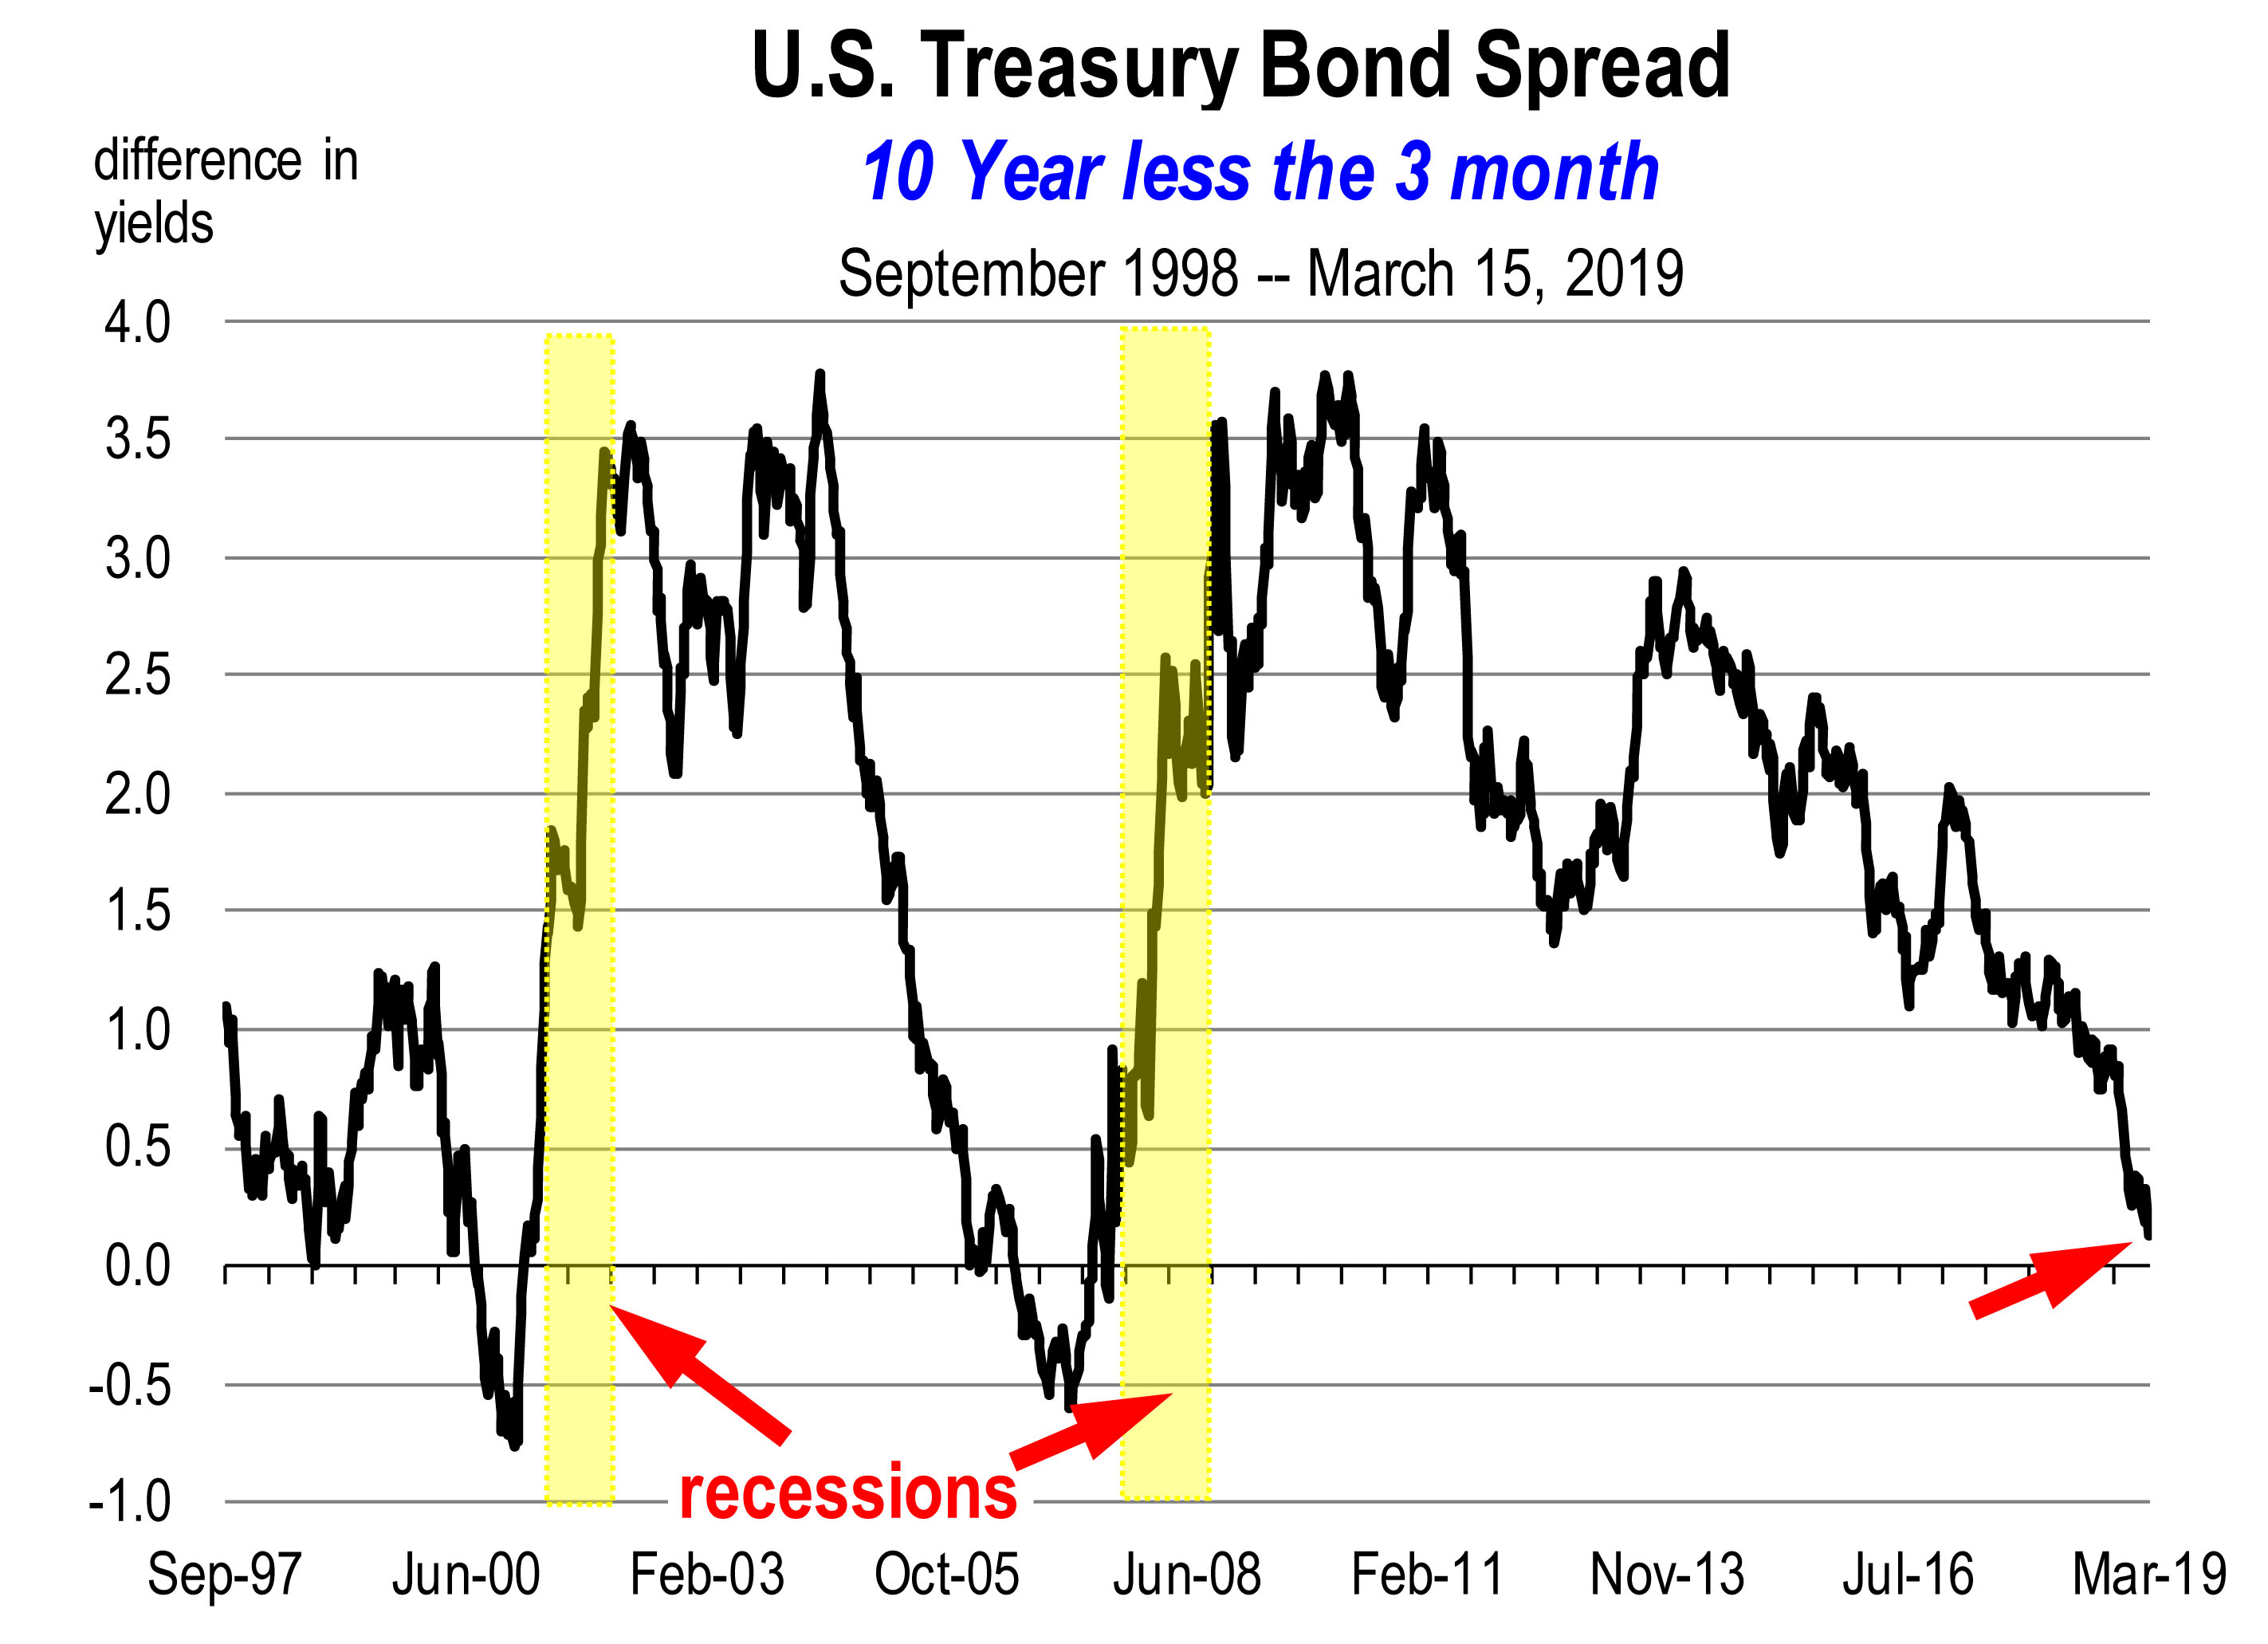
 An inverted yield curve is an interest rate environment in which long-term debt has lower yield than short-term debt of the same credit quality. It occurs when the 10 year U.S. treasury bond yield less the 3 month U.S. treasury bill yield turns negative. This is the conventional spread that is typically evaluated. Alternatively, other analysts use the yield spread between the 10 year and the 2 year T-bill.
An inverted yield curve predicts lower interest rates in the future. The belief that the economy is weakening moves investors to demand longer-term bond yields to lock in those rates. This sends the yields down. Since investors are not buying short term bills, their yields ultimately rise. And since the fed has raised the federal funds rate several times, short term rates have risen.
Clearly then, inverted yield curves occur when investors are bidding for longer-term bonds and thus driving down their yields because they are pessimistic about the short-term prospects for the economy.
There is pretty convincing evidence that inverted yield curves, with short rates higher than long rates, predict recessions. Presently the yield curve is not inverted regardless of which spread we use. There will be a prediction of recession when the spread inverts usually for a period of 2 to 3 months.
Is the Yield Curve Actually Close to Signaling a Recession?
Yes the spread is on a path heading straight for an inversion. We are near to that situation but we’re not there yet. If it remains on its current rate of trajectory, an inversion would occur this summer. However, right now the yield curve is not inverted regardless of which spread is used: 10 year less the 3 month, 10 year less the 2 year, or 5 year less the 3 month. Importantly, there is only a prediction of recession when the T-bill yield on shorter term debt exceeds the yield on longer term debt. So at this moment there is no forecast of an imminent recession in 2019 or 2020.
Furthermore inversion does not spell immediate doom. The evidence is that inverted yield curves, with short rates higher than long rates, predict recessions. Over the last 5 business cycles, the average recession occurred 11 months after the spread turned negative. The range is between 5 and 17 months.
When Will There Be a Recession?
While there will be a recession at some point, the issue is always when.
To repeat, currently the yield curve is not yet predicting recession but moving towards the point where recession would seemingly be imminent sometime over the next 24 months. And though an inverted yield curve has been a consistent predictor of recession since the 1960s, there is always the possibility of a false signal.
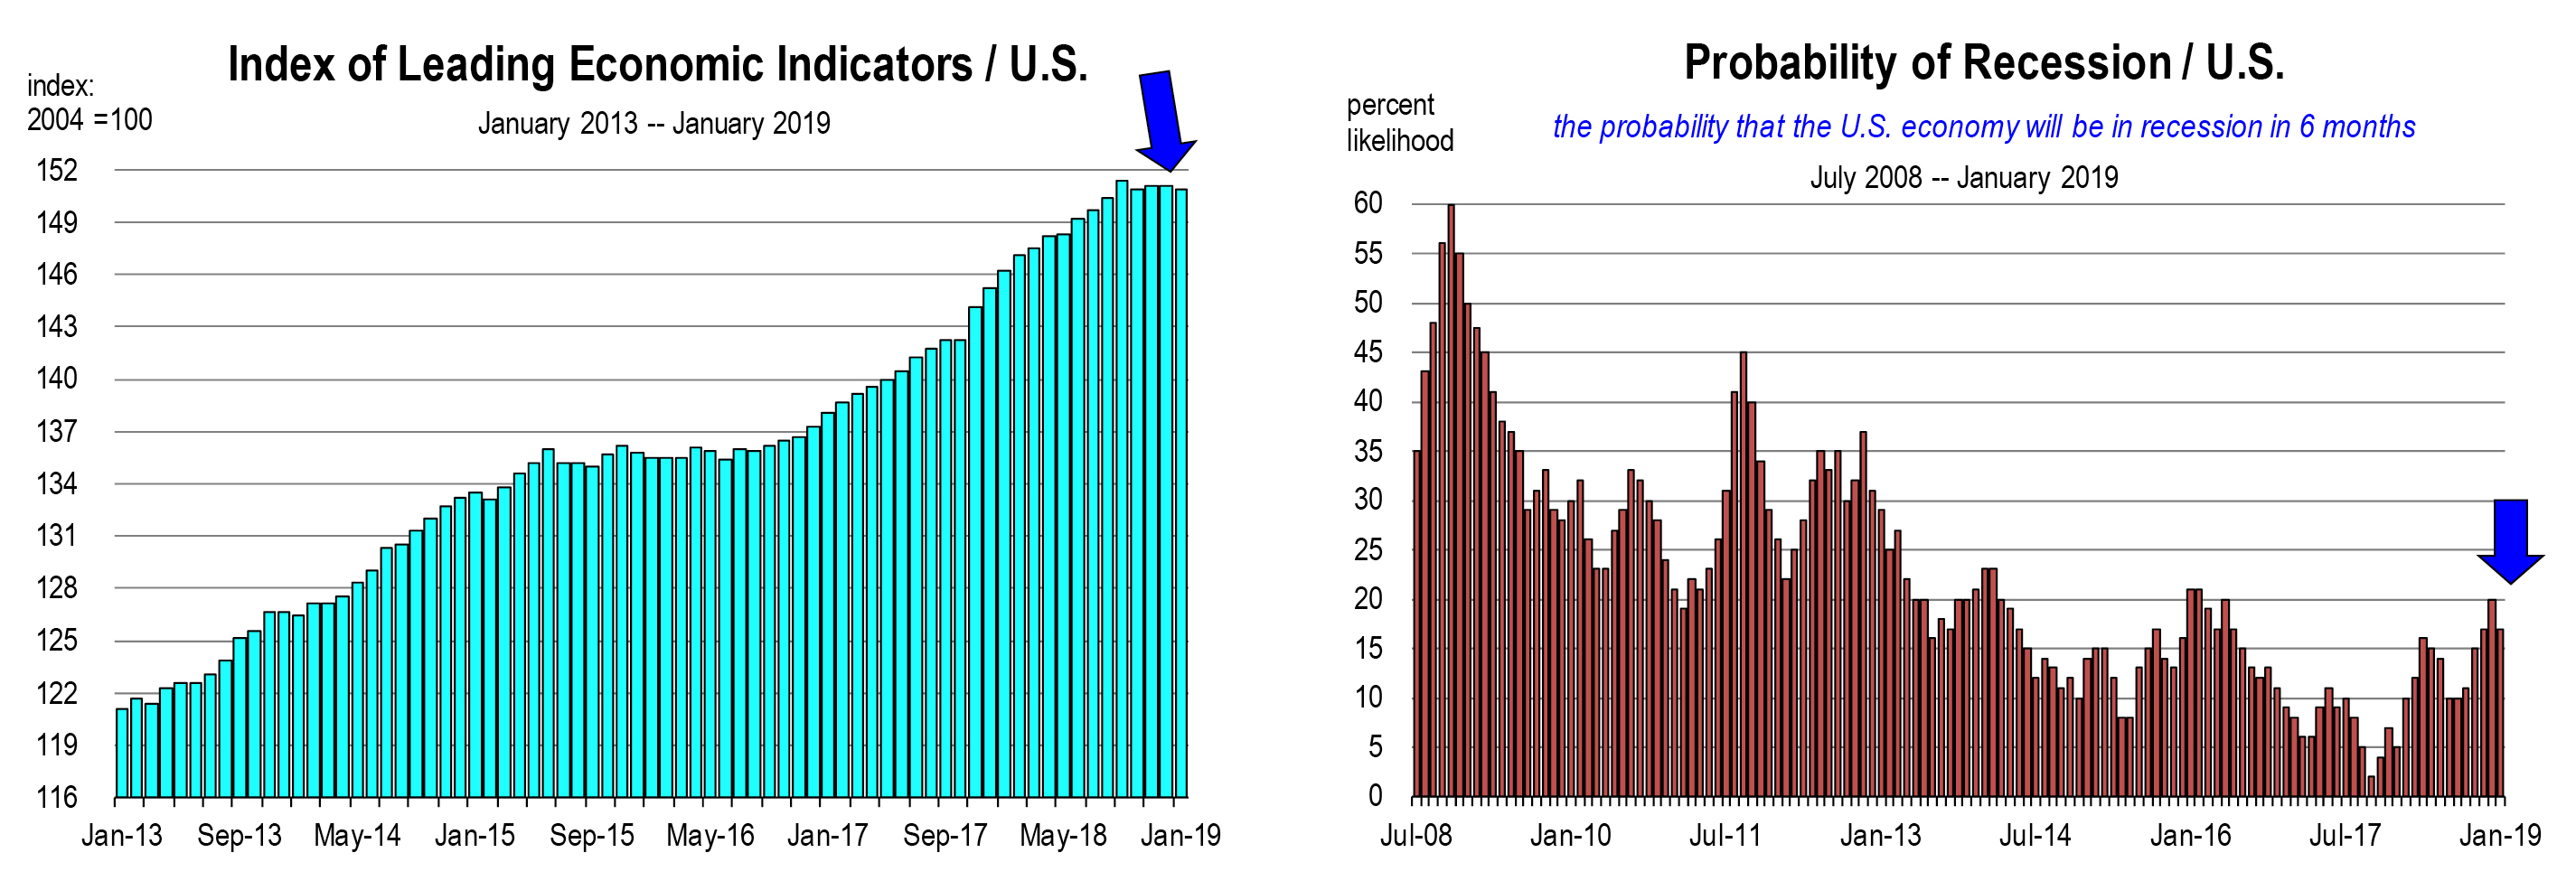
I think it’s also important to consider other indicators in the economy, such as the leading indicators index and the Risk of Recession index. Also consider the movement in stock market values. None of these indicators is predicting recession this year.

The California Economic Forecast is an economic consulting firm that produces commentary and analysis on the U.S. and California economies. The firm specializes in economic forecasts and economic impact studies, and is available to make timely, compelling, informative and entertaining economic presentations to large or small groups.


